


Equities Indices were flat on the weekly close last week yet SP 500 and NASDAQ appear vulnerable to additional losses. EURUSD has reversed towards 1.1430 support causing concern for bulls.
The video above is a recording of a US Opening Bell webinar from October 22, 2018. We focused on the Elliott Wave and patterns for key markets such as SP 500, NASDAQ, Gold, Oil, US Dollar Index, EURUSD, GBPUSD, and USDJPY.
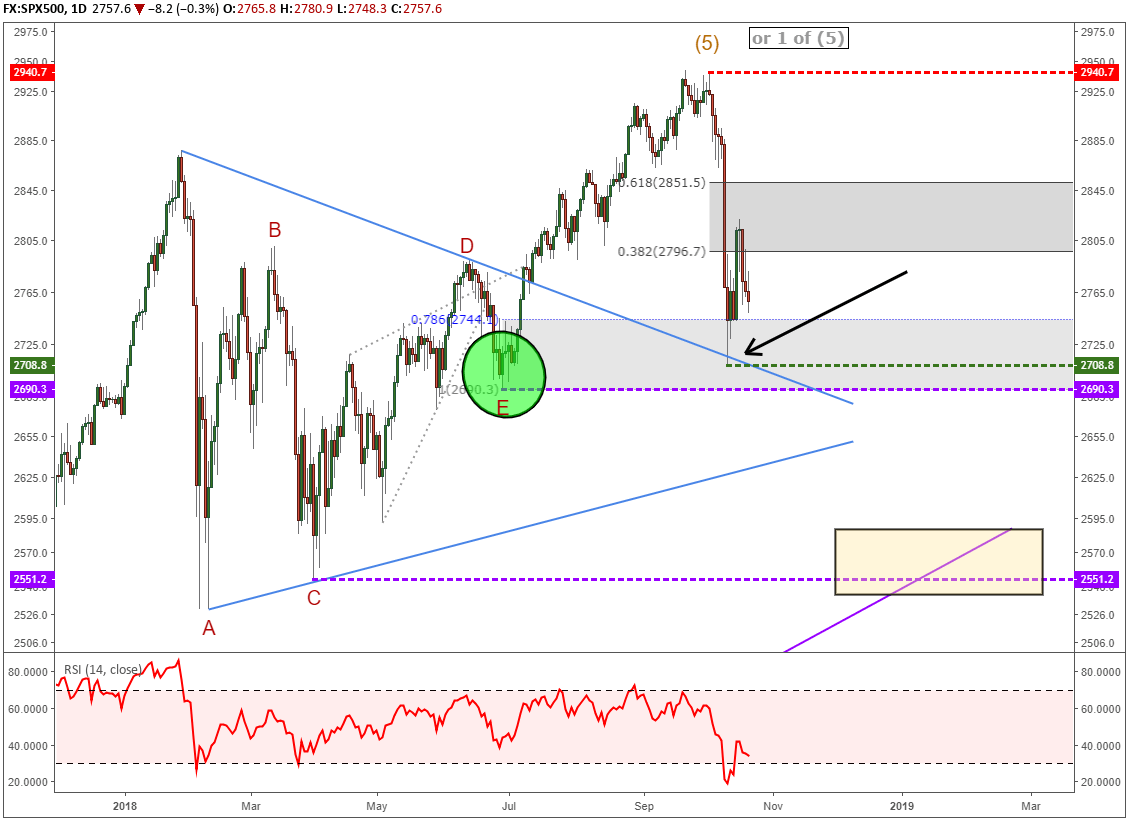
SP 500 Elliott Wave Consolidates Implying additional weakness
SP 500 chart started the week strong but ended on a weak note. This inability to materially rise indicates an overhang of selling pressure. The current Elliott wave is that SP 500 may be rising in a second wave or ‘B’ wave prior to another wave lower. Therefore, the Elliott wave structure indicates a break below 2708 is the higher probability move while SP 500 holds below 2941.
A break below the 2550 area becomes a strongly bearish pattern and implies longer-term losses back to 1800. Near 1800 is the previous fourth wave when assuming wave (5) is in place at the October 3 high.
From a bullish perspective, the inability to push below 2630 keeps the possibility alive that the current dip is simply wave 2 of (5). Bottom line, 2550-2630 is a price zone for the medium term direction to be determined.
Additional reading…
How to Trade S&P 500 Index: Strategies, Tips & Trading Hours
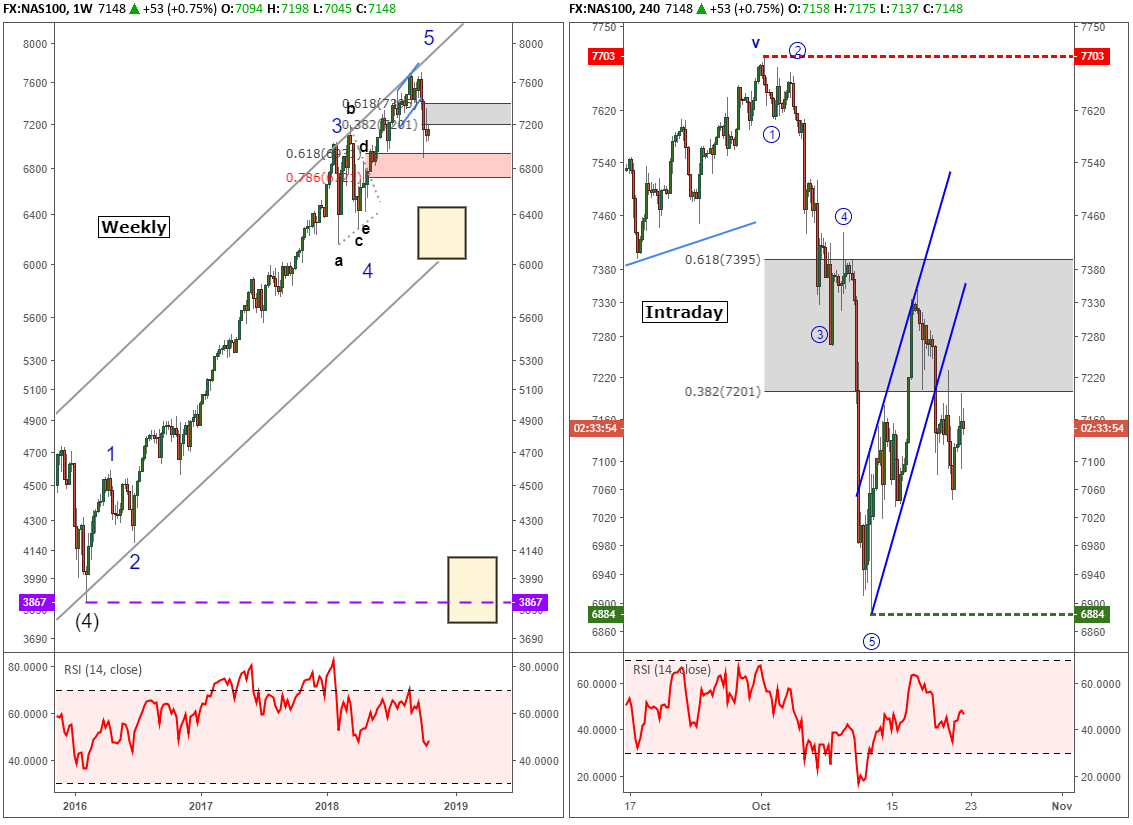
Nasdaq chart shows minimum waves in place from 2016 advance
The price action in NASDAQ 100 is similar to SP 500. On the right, we can identify a bearish impulse wave. This upward correction since then likely becomes only a partial retracement higher before leading to a bearish break below 6884. This view is valid so long as the October high is maintained.
If NASDAQ does break below 6884 and especially if it moves below 6720, then the chances increase that the high is in place. On a break below 6720, we await the next battle at the upward sloping grey channel line near 6200.
Though the grey channel line near 6200 may support an initial bounce or two, a break of this line opens the door to the previous fourth wave near 3870.
As you can see above, a lot is riding on the next 1000 NASDAQ points.
You might be interested in…
Difference between Dow, NASDAQ, and S&P 500
[
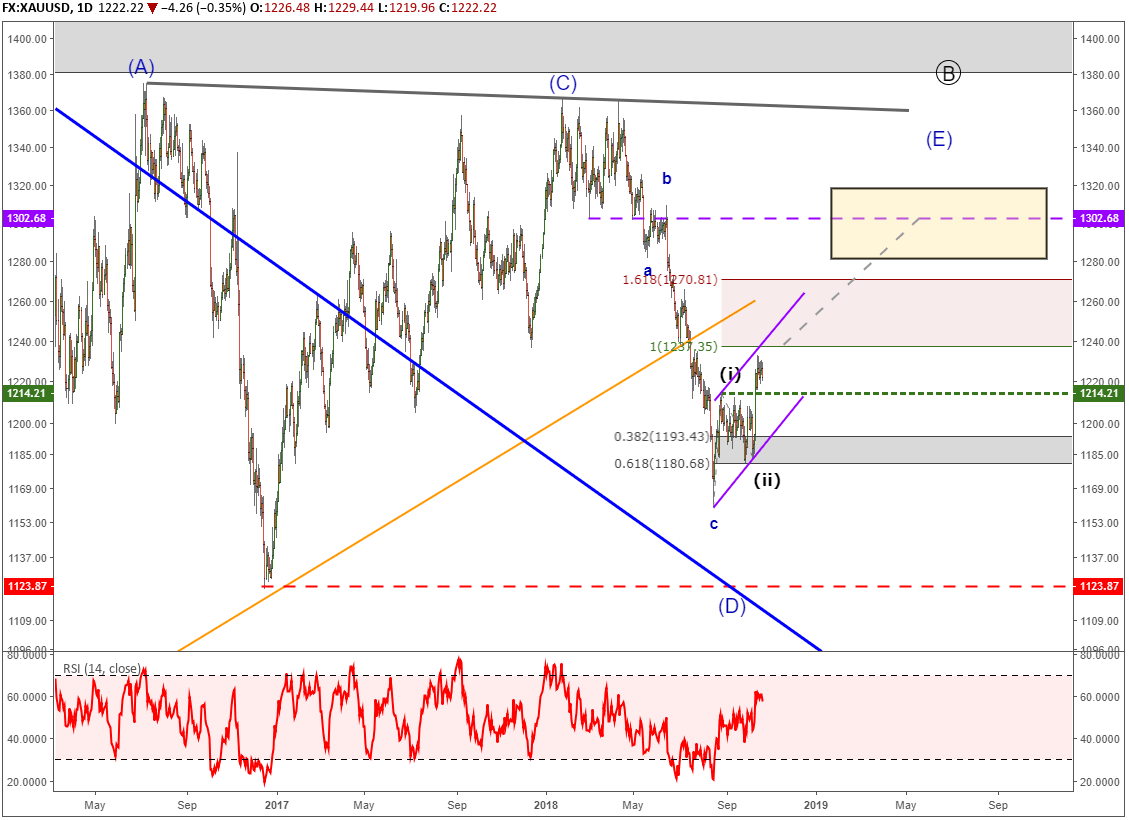
Gold prices consolidate recent advance
Gold prices spent the past week consolidating its recent jump to $1233. There are some Elliott wave relationships appearing near $1237. I am still analyzing this as an eventual break above here towards $1280, but the near term pause increases the options, some of which are bearish.
A dip to the recent breakout high of $1214 would be normal, but much below there and we will need to consider other viable Elliott wave counts.
The forecast outlined for gold prices at the end of August remain valid. That is to say a target of $1280-$1320. However, with the increased probability of near term bearish waves, there is not a good risk to reward ratio set up nearby.
Additional reading…
The Gold-Silver Ratio: Trading Tips and Strategies
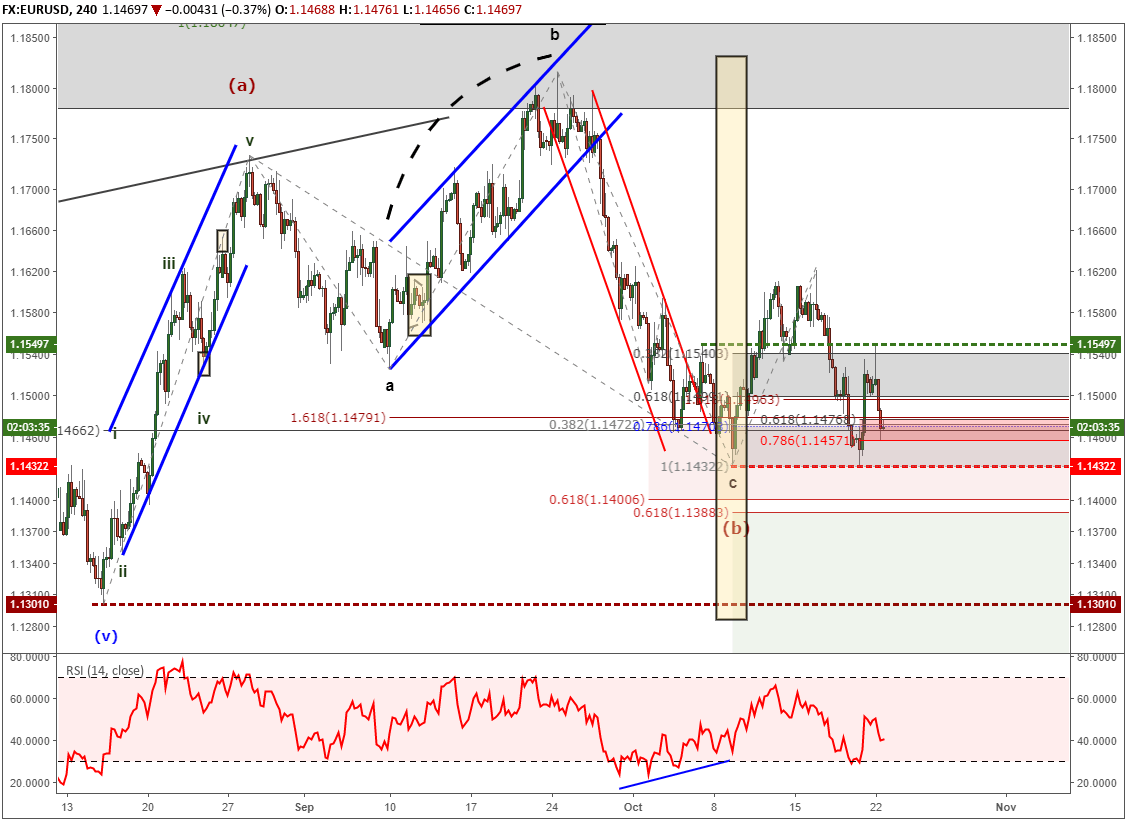
EURUSD Elliott Wave Chart Vulnerable to additional losses
The market often delivers surprises and last week was no different. We have been maintaining a good scent on EURUSD using Elliott Wave Theory and tracked an emerging bullish pattern for 1.1550 entry. After an initial spurt higher, EURUSD retraced back to 1.1432 just above our stop loss level.
At this point, the probabilities have shifted that a break below 1.1432 is on the horizon. The question then becomes has the trend lower already begun or will it begin on a last gasp for air up to 1.16? I cannot discern the odds either way but we will look to close out the long position prematurely near 1.16 if it does pop higher. Otherwise, our stop loss at 1.1430 is triggered taking us out of the trade.
Sentiment has shifted higher which signals the potential for continued moves lower so we are concerned about the potential for near term strength. Current live sentiment for EURUSD is +1.51 up from +1.09 last week.
Elliott Wave Theory FAQ
How does Elliott Wave theory work?
Elliott Wave theory is a trading study that identifies the highs and lows of price movements on charts via wave patterns. Traders analyze the waves for 5-wave moves and 3-wave corrections to determine where the market is at within the larger pattern. Additionally, the theory maintains three rules and several guidelines on the depth of the waves related to one another. Therefore, it is common to use Fibonacci with Elliott Wave analysis. We cover these topics in our beginners and advanced Elliott Wave trading guides.
After reviewing the guides above, be sure to follow future Elliott Wave articles to see Elliott Wave Theory in action.
---Written by Jeremy Wagner, CEWA-M
Jeremy Wagner is a Certified Elliott Wave Analyst with a Master’s designation. Jeremy provides Elliott Wave analysis on key markets as well as Elliott Wave educational resources. Read more of Jeremy’s Elliott Wave reports via his bio page.
Communicate with Jeremy and have your shout below by posting in the comments area. Feel free to include your Elliott Wave count as well.
Discuss these markets with Jeremy in Monday’s US Opening Bell webinar.
Follow me on Twitter at @JWagnerFXTrader .


