


Nasdaq 100, Dow, Tesla, Dollar, USDJPY and USDCNH Talking Points
- The Trade Perspective: S&P 500 Bearish Below 4,375; USDJPY Bearish Below 126
- Tesla’s robust earnings after hours Wednesday leveraged significant hope for Thursday’s trading session, but the slump for TSLA and the Nasdaq 100 would prove it fire wouldn’t catch
- Monetary policy was a more effective theme this past session with the Dollar drawing considerable benefit, but Friday will end with GDP the principal focus

Elon Musk Can’t Solve All Our Problems Apparently
Enthusiasm was high entering Thursday’s session, but all of that confidence had clearly evaporated by the time the day ended. There haven’t been many macro themes to point to if you are a bull looking for a reason to ‘buy the dip’. That is what made the earnings report from Tesla after Wednesday’s close so appealing. If we can’t draw from growth or favorable monetary policy to bolster spirits, perhaps GAAP could rouse the bulls back to court. After Netflix’s unmistakably painful quarterly update, the pressure was on for the EV automaker – and sixth largest market cap stock for the US financial system – to help shore up wayward conviction among the speculative class. To the company’s and CEO Elon Musk’s credit, the numbers were remarkable. And yet, the market would still not find the traction necessary to keep bulls in charge. TSLA shares gapped sharply higher on Thursday’s open but would ultimately end the day significantly off its highs. For the broader indices and risk measures without the same aggressive open, the retreat was far more prominent a feature.
Chart of Tesla with 100-Day SMA with Volume and Opening Gaps (Daily)
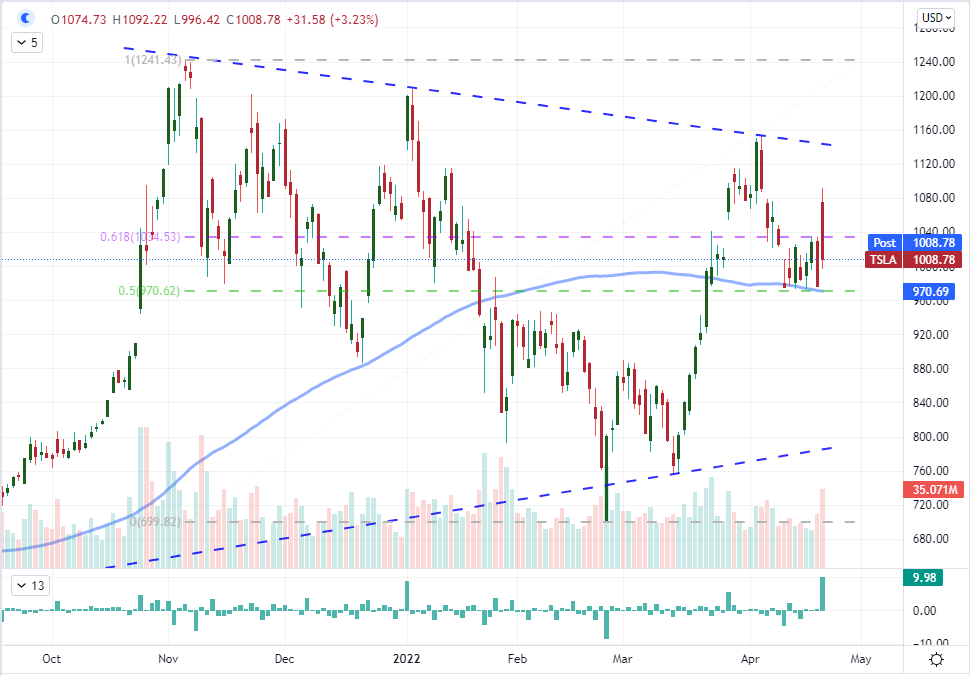
Chart Created on Tradingview Platform
Netflix may not be as big a player in the overall performance of the FAANG – and further the tech sector – as it has been in previous years, but it still throws its weight around. That said, the earnings miss from the streaming service roused some serious concern and put the Nasdaq 100 in a precarious position. With bulls unable to capitalize on the positive message from a far larger market cap stock (Tesla), it suggests that there isn’t as much dry powder to recharge the larger bull trend as had been previously assumed. For the tech-heavy index, the past session would actually close with a break through the floor of the past 7-day range. That is a precarious position for the markets to be in on a technical basis. For next steps, I will be watching the S&P 500 which has moved to the bottom of its own range; but the floor around 4,375 (the midpoint of the February 24 to March 29 range) will be a next milestone for conviction.
Chart of Nasdaq 100 with 20, 100 and 200-Day SMAs and 7-Day Historical Range (Daily)
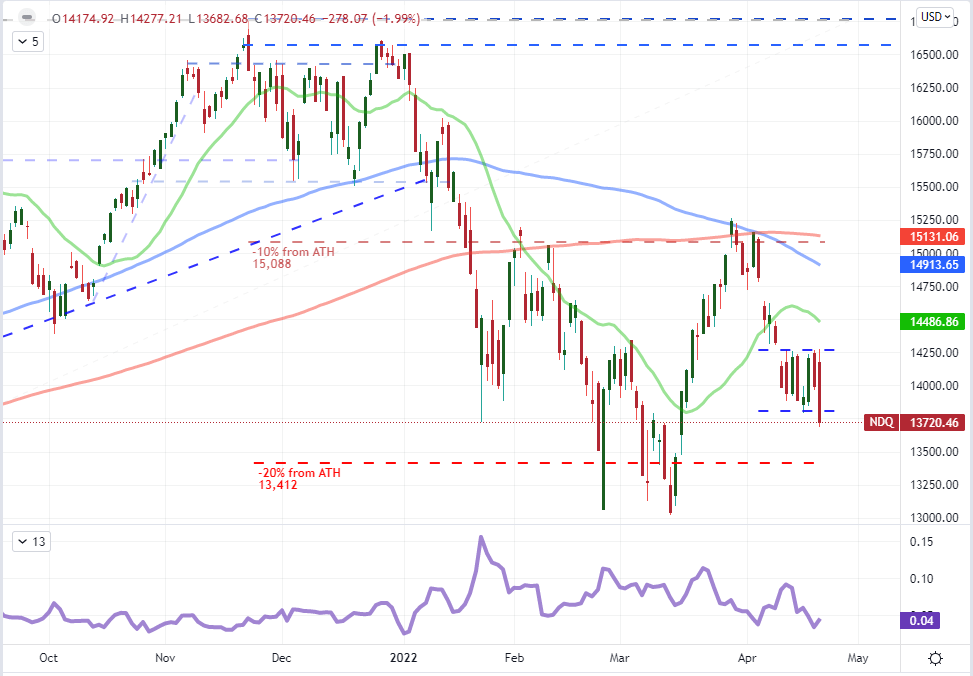
Chart Created on Tradingview Platform
The Fundamental Focus Will Change for Friday
If I had to point to a particular fundamental theme to follow this past session, I would have said US earnings was the most potent possible driver. Yet, as discussed above, Tesla’s ability to change the (financial) world would ultimately prove limited. Friday is light on the earnings calendar, so serious movement will need to draw from more traditional fundamental themes. Monetary policy is absolutely an area to follow – particularly if you are an FX trader. The divergence in policy is growing ever more apparent and extreme. This week, we had already seen the Bank of Japan commit to potential unlimited bond purchases to target its ideal JGB rate (though it weakly said intervention was not being considered), while ECB President Lagarde tried to play down worries of currency targeting – which is a natural concern for policy holdouts. This is no time to look away from monetary policy either in relative or aggregate terms, but the docket seems better tuned to a ‘growth’ perspective. On the heels of the IMF’s broad downgrade for economic activity, we are now due the major Western economies’ April PMI figures. I gauge these measures’ market-moving ability on the focus from speculative markets – and they seem focused in on the threat economic health represents.
Calendar of Major Economic Events
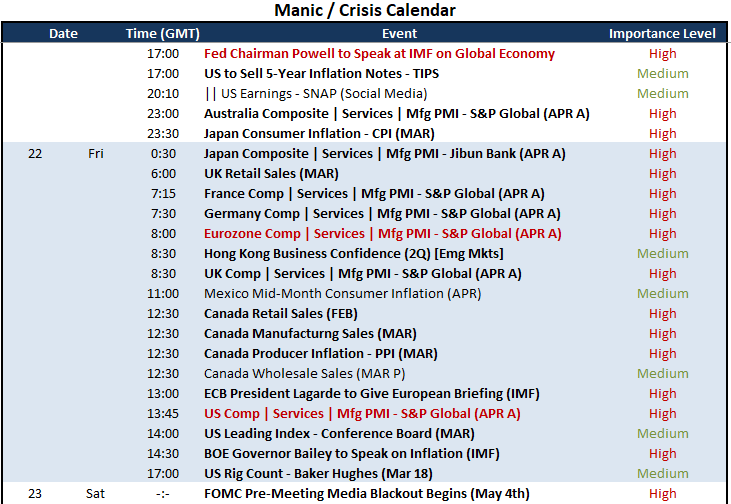
Calendar Created by John Kicklighter
While there are numerous ‘risk’ oriented measures to monitor moving forward, I consider the (safe haven) US Dollar a very appropriate measure to track. Not only is the relative rate forecast assessment a boon to the Greenback, but it also happens to carry a safe haven designation. For the Dollar, the particular brand of lift is more along the lines of a ‘haven of last resort’ quality; but it can certainly move in the middle of the tide. At the moment, we don’t seem to have full-blown risk aversion, yet the outlook for US rate forecasts somehow continues to build. To be fair, swaps as a measure of market conviction are only pricing in a benchmark rate of approximately 265 basis points (2.65 percent) by year end, but the Fed’s own range from dove to hawk has recently spanned 250 to 350 bps. So there is still some market discount at play that could offer the Dollar further lift. That said, the intraday reversal from the DXY Dollar index this past session left the largest bullish wick (reversal from low) since September 10, 2020. That previous turn was a spark for a more substantial recovery off lows. We don’t seem to be pressing the floor very hard now.
Chart of DXY Dollar Index with 20 and 100-Day SMAs, ‘Wicks’ (Daily)

Chart Created on Tradingview Platform
According To The Event Risk
If you are looking for fundamental motivation through the final trading day this week, the April PMI measures are top billing. This run of data is an important gauge of developed world – even global – economic health. Earlier this week, the IMF issued a clear warning for the global economic forecast through its updated WEO (World Economic Outlook). The market itself conspicuously downplayed the news, but we can’t ignore reality forever. Should the monthly economic reports prove a threat, the dam could very well break. That said, out the systemic, I think a particularly intriguing pair for volatility would be NZDCAD. This past session, we registered a modest miss in New Zealand inflation which had a disproportionate hit to the Kiwi Dollar. Ahead, we have a run of Canadian data that will no doubt stir monetary policy expectations. The greater the shift in relative expectations between these two, the more impactful the change in the cross.
Chart of NZDCAD with 20 and 100-Day SMAs (Daily)

Chart Created on Tradingview Platform
One last area to watch out for that isn’t purely data central is the USDCNH. Aside from the US data, there isn’t anything of great reach on the economic side that I would point to which positions this pair for remarkable movement. However, the backdrop of the exchange rate as a political tool for Chinese authorities earns it a position in the hierarchy. Through Thursday, this pair registered a third, massive rally. Overall, we are looking at the heftiest bullish week since September 2019. Such a remarkable move fits the divergent rate and growth expectations, but the allowance for the advance is something that cannot be overlooked. Even if you don’t intend to trade this pair, you should monitor its performance.
Chart of USDCNH with 200-Day SMA (Daily)
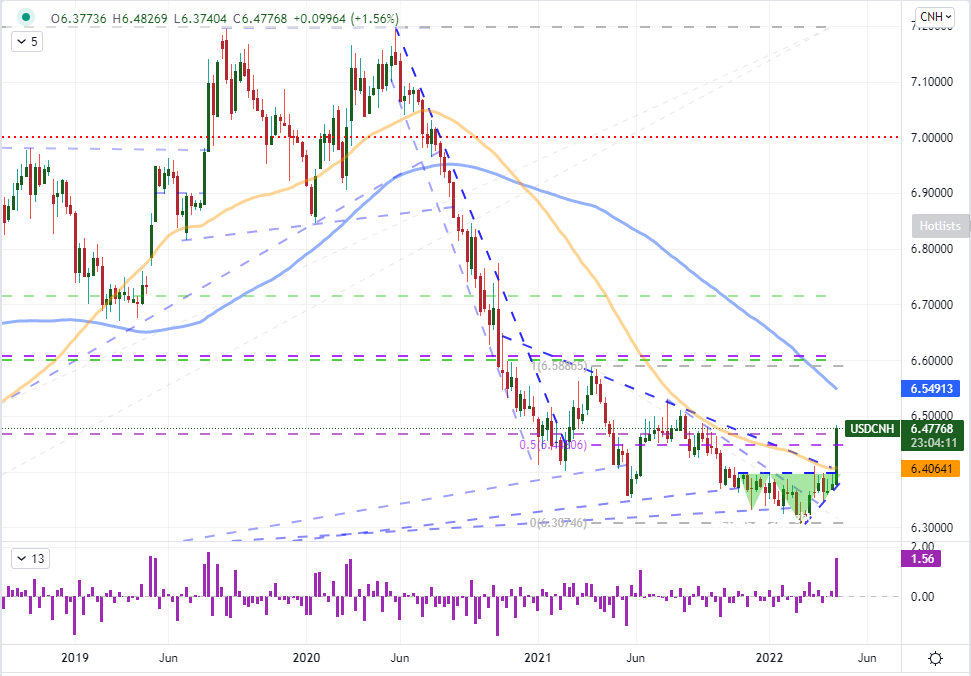
Chart Created on Tradingview Platform


