


Nasdaq 100, Dow, Tesla, Dollar, USDJPY and USDCNH Talking Points
- The Trade Perspective: S&P 500 Bearish Below 4,375; USDJPY Bearish Below 126
- The hit from Netflix’s earnings hit the Nasdaq 100 hard Wednesday, but will Tesla’s beat balance it out Thursday?
- A pullback for the Dollar seems overdue, but is this pent up correction a true reversal for EURUSD, USDJPY and USDCNH or a mere breather?

When Risk Assets Diverge, There Is No Definitive View on Sentiment
Depending on what benchmark you prefer to monitor for an overview of market health, you may have closed this past session with a very different perspective of the prevailing trend. Against a mix of global indices, emerging market assets, junk bonds and carry trade; there was a remarkable amount of imbalance even within the US indices. Notably, the blue chip and ‘value’ leaning Dow Jones Industrial Average sported a health 0.7 percent advance while the broad S&P 500 was little changed on the close after tentatively pressuring the midpoint of the 2022 range again. The standout, however, was the tech-heavy Nasdaq 100. That particular index had lead the charge for ‘risk appetite’ up through the end of 2021. Yet, since the ratio of the ‘growth-value ratio’ (Nasdaq 100 to Dow) peak on December 1st – a very conspicuous double top to the March 2000 Dot-com boom/bust high – we have seen a meaningful pullback. Naturally, with the Nasdaq sliding -1.5 percent this past session, the ‘high touch’ risk reading would feel the weight. Thursday’s New York session will open with the Nasdaq eying the floor of its 7-day range, but a break lower would now reflect a far more significant event given the circumstances.
Chart of Nasdaq 100 with 20 and 200-Day SMAs and 7-Day Historical Range (Daily)

Chart Created on Tradingview Platform
So long as there is not a systemically important theme that is roused between now and Thursday’s New York open, the prevailing assumption would be for a rebound for the Nasdaq 100. There is certainly technical consideration catering to that view in the form of the aforementioned range, but the real lift would be fundamental. In direct contrast in the unmistakable shortfall of the NFLX earnings after Tuesday’s close, the top corporate performance billing after the close this past session was the announcement by Tesla. More than just a leading EV maker; this company has been at the center of multiple speculative swells (meme stocks and cryptocurrency). Yet, its real heft is found in the fact that TSLA is the sixth largest market cap among public stocks. As far as representatives of the broader market – much less the tech sector – go, this is a serious signal for investors in equities and beyond. Following the better than expected $3.22 EPS and record $18.76 billion revenue report, the stock registered a post-close rally back to its range high. The same kind of gap and projection that the NFLX suffered to the downside will be presumed for TSLA on the bullish course. Should that fail to materialize and we threaten to pressure 975, it could deal a severe blow to the market’s innate ‘markets go up over time’ mentality.
Chart of Netflix with 20 and 200-Day SMAs with Afterhours Performance (Daily)

Chart Created on Tradingview Platform
Not All Fundamentals are Earnings
Direction is important to establish in an undercurrent as fundamental as risk trends, but conviction carries substantially more influence when it comes to evaluating trade opportunities. For momentum, we are best served by finding a guiding light in fundamentals that can lead market participants to recovery or collapse. Earnings has potential, but the final 48 hours of trade this week is light on this front. I will watch updates for once-leading tickers like social media company SNAP, but the top influencers will have to wait until next week’s larger FAANG members. Suffering a similar fate of relegation to the backdrop, it seems the IMF’s harsh downgrade of growth forecasts for the global economy has rolled off investors’ backs. We were expecting a significant cut to the outlook following the rampant inflation and blowback from Russia’s invasion of Ukraine, but I don’t think we have seen the market fully price in the implications there. Nonetheless, we need to keep tabs on the matters that are actively moving the markets. Monetary policy looks as if it will pick back up the baton. Monetary policy is where we frequently return.
Calendar of Major Economic Events

Calendar Created by John Kicklighter
This past session, the Canadian Dollar rallied sharply after last month’s CPI data fended off an expected moderation with an actual further surge in headline and core prices. I didn’t think a surprise of this magnitude in the opposite direction of the consensus was probable. We’ll see if the New Zealand 1Q CPI is capable of a similar shock, but the more nuanced discussion to shape trend rather than short-lived volatility remains the Fed’s course. On the one hand, hawkish leaning Bostic seemed to issue rare caution about expecting too aggressive a pace of tightening, but reliable dove Daly seemed to back Evan’s forecast for a 2.50 percent benchmark by year end that sets the lower end of this spectrum very low. Notably, the DXY ICE Dollar Index took a big hit this past session; but there was little to motivate the adjustment. Rate forecast were holding up well while the relative growth outlook was still a tail wind. Unless we crack further relevant technical support, this registers as more ‘a breather’ than a reversal. But, I’m always on the watch for more critical technical development.
Chart of DXY Dollar Index Overlaid with 2-Year Yield and 1-Day ROC (Daily)
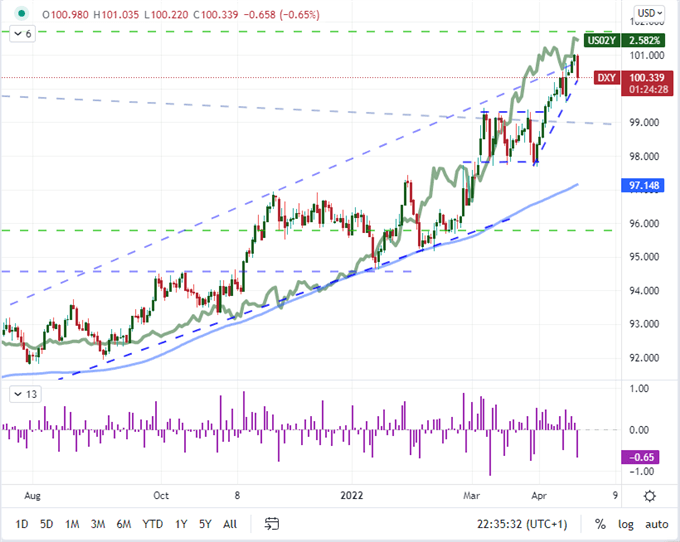
Chart Created on Tradingview Platform
Pairs to Watch for Fundamental Insight
While my attention is affixed to the next moves of the US indices for insight to broader speculative appetite and a pair like EURUSD reflects serious interpretation owing to its liquidity, my interest for top fundamental signaling rests elsewhere. USDJPY remains one of the most intriguing assets in the financial system – not just FX. The charge we have seen these past few months is extraordinary for its consistency. That said, Wednesday’s pullback looks overdue and some will be tempted to call a full reversal. I would urge caution on that interpretation. This pair has certainly overrun, but markets can ‘remain irrational’ for far longer than many think possible. A firm contribution to the lift on USDJPY and other Yen crosses, is the BOJ’s refusal to relent on its extreme accommodative policy – vowing to buy unlimited JGB (government bonds) to keep the long rate anchor. That is the exact opposite driver to snuff the fire out in the Yen.
Chart of USDJPY with 20 and 100-Day SMAs with 1-Day ROC (Daily)
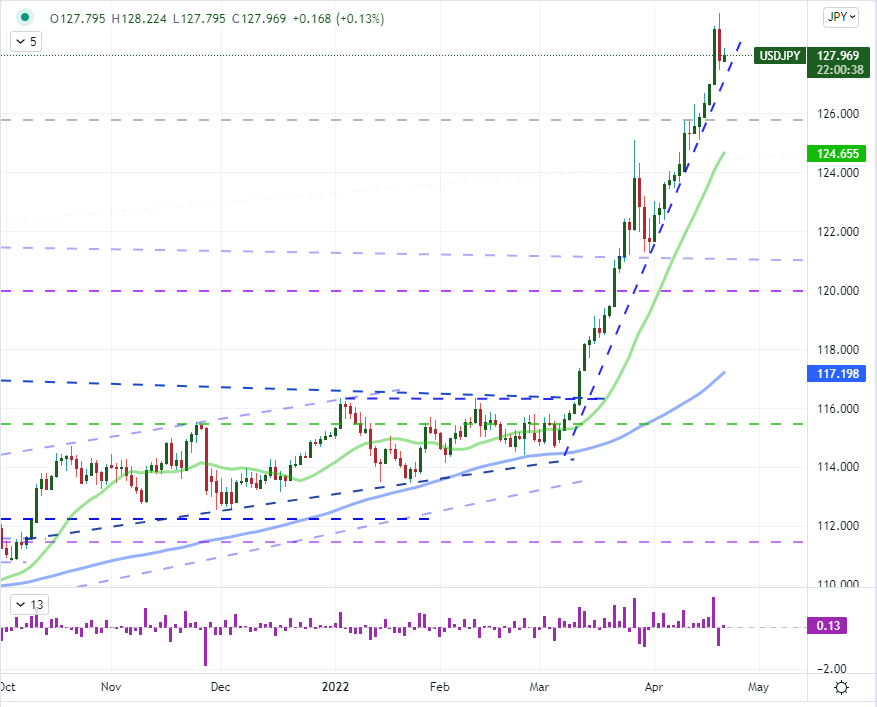
Chart Created on Tradingview Platform
Outside of the normal mix of majors, I am finding good reason to keep watching on the Dollar – Chinese Yuan (USDCNH) exchange rate. The pair extended its break above 6.4000 to a second strong day’s rally. That may look natural to a technician that doesn’t know the backdrop, but this kind of charge is remarkable. The issue is that this pair does not represent an open market. Far from it. There is purposeful control measures to prevent exchange rate volatility and even directional movement that has more political implications than an effort to balance current account issues. With USDCNH pushing 6.45, I’m not looking at this as a technical test for a move to the next level by market participants. Rather, this is an assessment of what policy officials intend for the exchange rate to help growth ambitions.
Chart of USDCNH with 200-Day SMA (Daily)
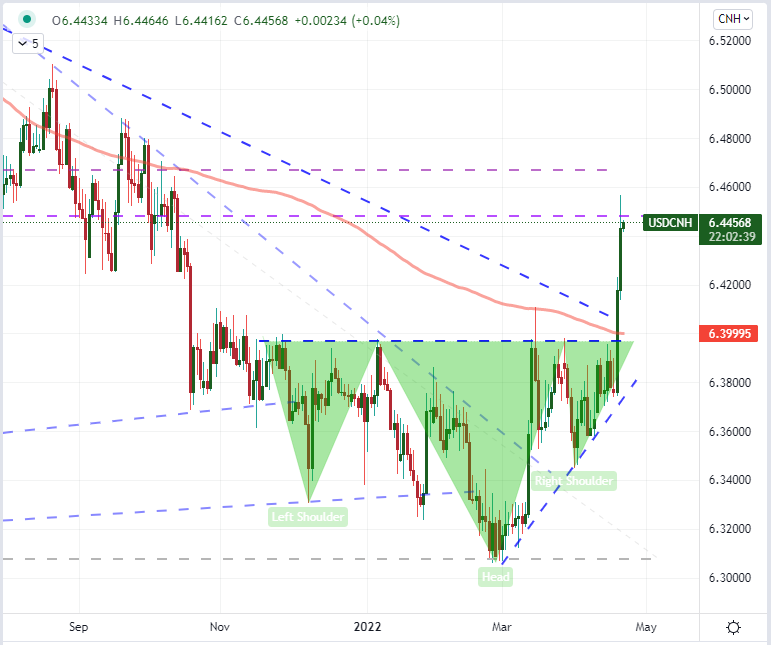
Chart Created on Tradingview Platform


