


Nasdaq 100, Crude Oil, Dollar, Shanghai Composite and AUDNZD Talking Points
- The Nasdaq 100 and S&P 500 revived last week’s slide to open the week with further critical technical levels in view, but not all ‘risk’ assets are lining up
- Among the top fundamental themes to track, troubled US-Chinese relations built on the Evergrande situation to start the week, but monetary policy is in view with the RBA and RBNZ
- Top fundamental threat is the US debt ceiling deadline which President Biden has affirmed is a tangible threat with even the Dollar’s safe haven status distorted

Risk Aversion Picks Back Up but Fear Still Uneven
Confidence can be difficult to break when the market has default to a ‘buy the dip’ or ‘diamond hands’ mentality for so long. Yet, that fundamentally-thin certitude continues to develop larger cracks with certain benchmarks like the S&P 500 extended reversals and plenty of fundamental kindling to build the fire. Though the escalating tensions between the US and China is gaining serious traction, the most systemic threat on my radar is the US debt ceiling crisis. The improbability of catalyzing one of these difficult-to-calculate threats is likely keeping the markets from fully collapsing into fear, but we are getting closer to a speculative ‘accident’. Leading the recent slide, the Nasdaq 100 dropped another -2.1 percent – just the third two percent or greater drop in five months. There are critical technical levels to monitor on the way down, but the ‘technical correction’ (-10 percent retreat from highs) is likely the more recognizable tipping point.
Chart of Nasdaq 100 with 50 and 200-Day Moving Averages (Daily)
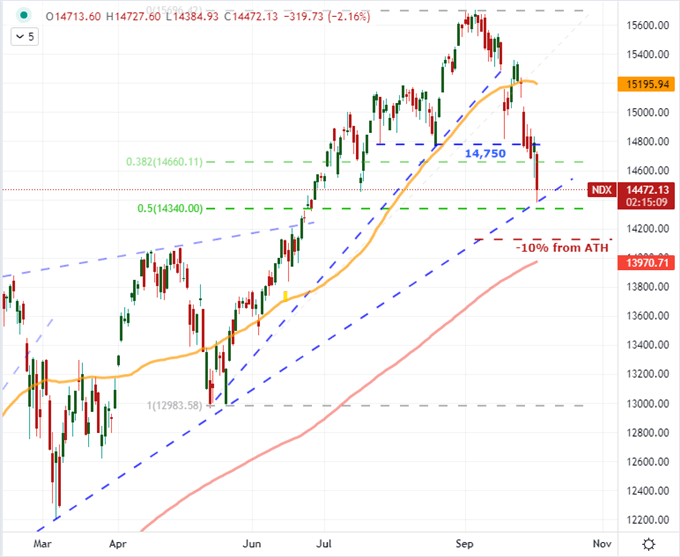
Chart Created on Tradingview Platform
Despite the technical standings of the US indices, not all markets are in as ominous position as the Nasdaq or S&P 500. Commodities are on a particularly divergent trajectory with crude oil leading the charge with its highest close since 2014 Monday. A number of commodities with growth and speculative relation are in a similar position, but that has likely more to do with the supply side price charge than the healthy demand drive. Other assets closer to the SPX on the speculative scale are similarly noncommittal. Carry trade in the FX markets and European indices are similarly tracking out congestion rather than a distinct trend.
Chart of US Crude Oil with 50, 100 and 200-Day SMA with Volume (Daily)
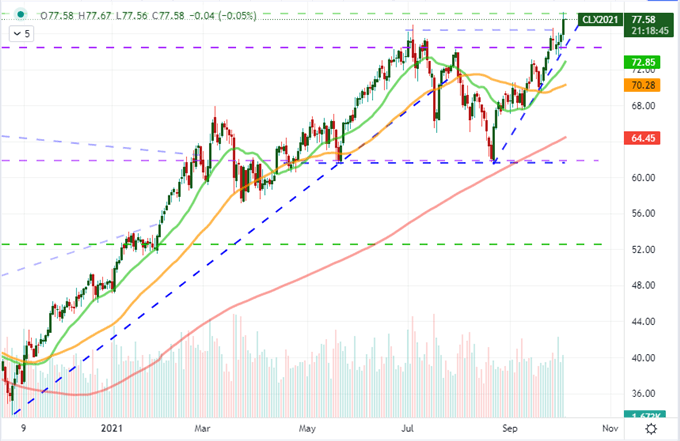
Chart Created on Tradingview Platform
If we are to find a market-wide trend develop, it is likely to develop in a wholesale shift of capital that comes with a great migration of wealth out of higher return assets seeking relative safety (ie ‘risk aversion’). While it is useful to track the nuance of this shift as leading indicators draws other more stoic assets into fear’s gravity, my preferred measure of sentiment is the correlation across a wide range of capital markets paired with the intensity of move. There are certainly plenty of worrying flare ups of late, but it still does not look to be reaching the level of sustainability we have seen in previous bouts of global unwind.
Chart of Risk Severity Curve
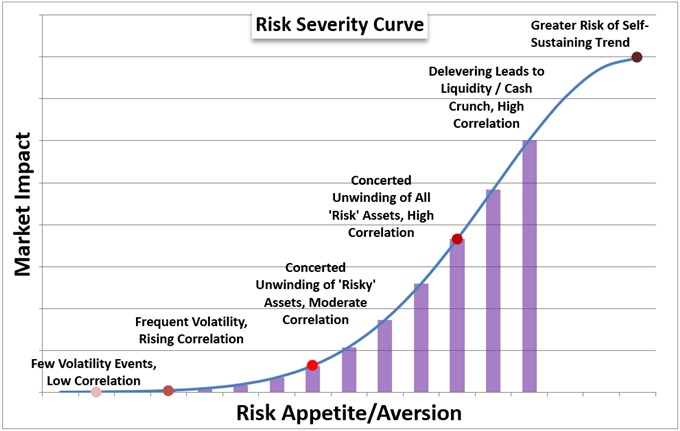
Chart Created by John Kicklighter
What are We Watching to Start This Week
To turn the tables for market sentiment, it is important to track the scheduled and unscheduled events that can charge sentiment across the widest swaths of market exposure. Monetary policy normalizing after years of extreme accommodation is perhaps the highest probability theme but it is also happening at a very slow pace. That raises my interest in Friday NFPs but it doesn’t look to be an imminent catalyst. Meanwhile, the US debt ceiling seems to be getting greater and greater attention as the deadline approaches and the fear over a Chinese-founded crisis has taken a new angle as relations with the US have deteriorated materially just over the weekend.
Google Trends Search Interest in NFP, FOMC, US China, Taper and Debt Ceiling
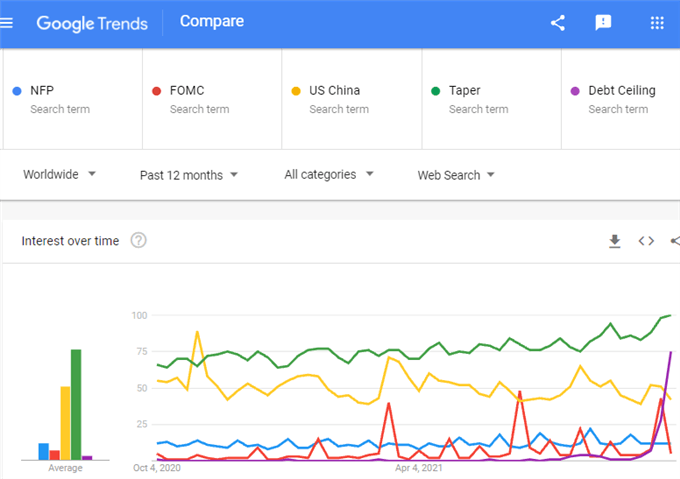
Chart from Google Trends
We are now less than two weeks away from the October 18th deadline which Treasury Secretary Janet Yellen stated would mark the point at which the US will exhaust extraordinary efforts to free up cash and hit the debt ceiling. Despite the urgency and the systemic threat which this represents to the not just the US but global financial system, the government made no progress over the weekend and through Monday. President Joe Biden addressed the nation on the risk and responded to a question that he could not guarantee that the country would avoid the ceiling. While there are still means to maneuver for Congress and the White House, the risk of accidently going over the cliff is rising rapidly. I believe a crisis will be avoided, but the brinkmanship may yet earn the country another downgrade from one of the three major rating agencies – which is a serious turn of events in itself.
Chart of US Federal Debt Total and Quarterly Change (Quarterly)
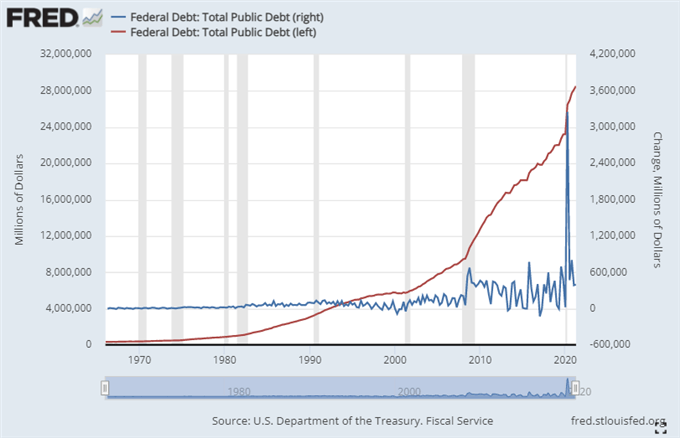
Chart Created on Federal Reserve Economic Database with Data from US Treasury
When we take into consideration the intense domestic threat from a US default, the Dollar’s continued retreat through Monday’s trade is more explicable. These past weeks, the Greenback has benefit from expectations of a Fed taper despite the upheaval in the group’s ranks (amid a trading scandal which seems to be circling Vice Chair Clarida as well) as well as the general risk aversion that has revived the currency’s own safe haven properties. Given the local benchmarks for speculative appetite (eg Nasdaq 100) have positioned for a deeper fall, the focus on the debt ceiling as the principal driver seems to hold more weight. Thus far, the DXY Dollar Index has only fallen back to its previous breakout point, but these matters seem far from resolved so don’t presume technicals alone will dictate next moves.
Chart of DXY Dollar Index Overlaid with US 10-Year Yield (Daily)
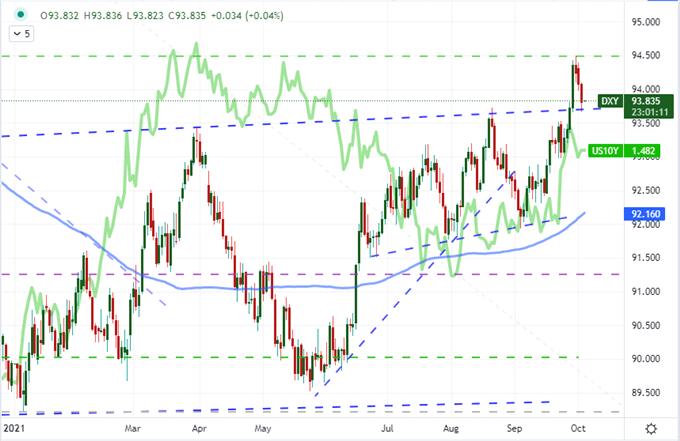
Chart Created on Tradingview Platform
Chinese Concerns Grow and Monetary Policy Will Sneak In Under the Radar
Another systemic fundamental risk that has received a significant jolt to start the week is the situation in China. Over the past few weeks, the concern over the country’s financial health was elevated as property developer Evergrande missed interest payments and struggled to raise capital. The fears that this may turn into the largest default in history persist, but the controlled fallout from this risk has found a different angle amid headlines Friday evening that the US Trade Representative’s office found China to be in breach of the Phase 1 trade deal struck back in 2018. Further elevating the heat state between these top two players was the diplomatic warnings hurled between the two over Taiwan. China has increased its probing of the disputed territories’ airspace to unprecedented levels, leading to a stern warning by the US.
Chart of Shanghai Composite and FXI China ETF with Volume and 60-Day Correlation (Daily)
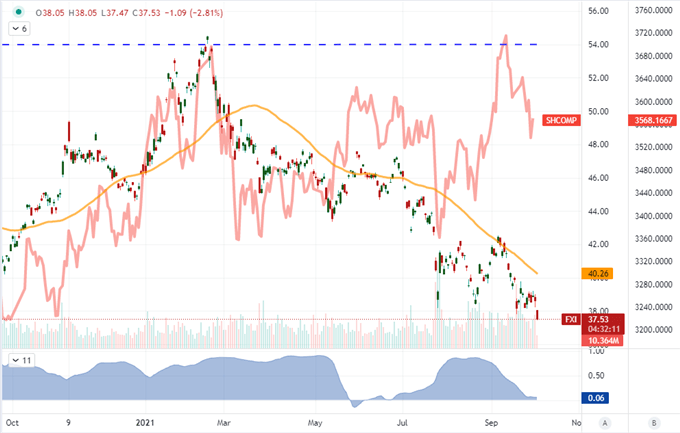
Chart Created on Tradingview Platform
In the scale of global reach, the monetary policy theme is the lowest risk on the totem for the coming session. Nevertheless, there is a very distinct risk on the immediate horizon between the Reserve Bank of Australia and Reserve Bank of New Zealand rate decisions. It is the latter’s policy meeting on Wednesday morning that carries the greater weight with a forecasted 25 basis point rate hike that was temporarily delayed by the closer of the country amid a spat of Covid cases. Despite the expectations there, the Kiwi has drifted. Both could prove a market moving event for their respective currencies.
Chart of AUDNZD with 50-Day Moving Average
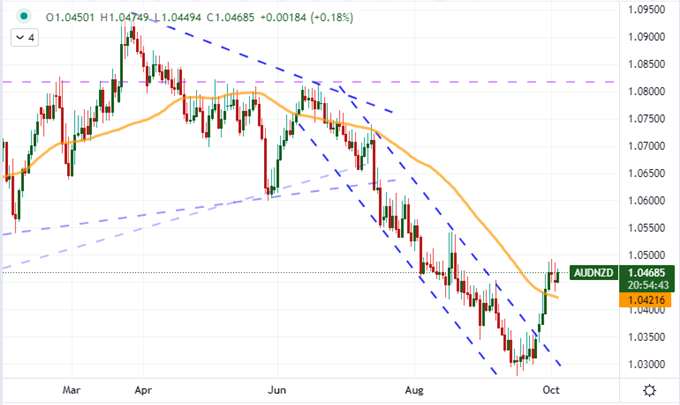
Chart Created on Tradingview Platform


