


Nasdaq 100, Bitcoin, S&P 500, EURUSD and NZDCAD Talking Points
- The US markets are back online after the holiday period, but a commitment to a clear ‘risk’ trend moving into fall trade has not been made
- A rebound for the Dollar looks like a bounce while Bitcoin led the crypto market on a not-infrequent flash crash
- While there are a number of unfolding fundamental themes for the market to chew on, monetary policy remains the focus with the BOC and ECB decisions ahead

And Fall Trade Thus Begun
American and Canadian traders were back online this past session after an extended holiday weekend, and the impact on speculative activity was as tangible as the lift in liquidity itself. We are navigating back into historically active trading conditions through the month of September, but the flip from ‘doldrums’ to broad trends doesn’t happen in a single session. As the markets fill and normal catalysts urge more significant moves in price action, we will eventually reach a tipping point where complacency will be upended and any significant fundamental spark can ultimately light that fire. At present, it seems that the coronavirus’s influence on growth forecasts, the slow monetary policy U-turn and concern over fiscal support are the most overt matters for the rank to chew on.
Chart of Seasonal Monthly Performance of S&P 500, Volume and Volatility
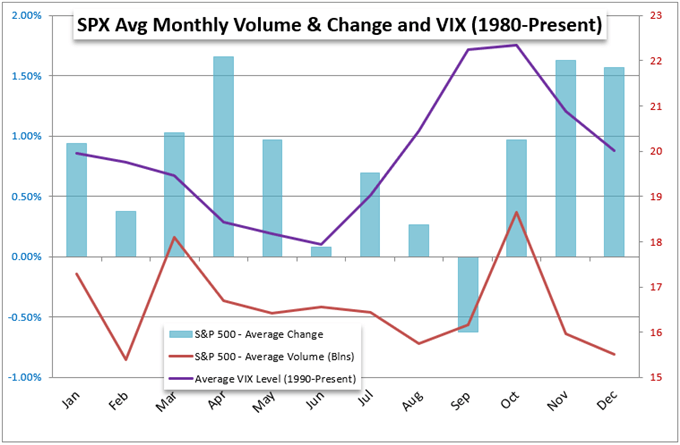
Chart Created by John Kicklighter with Data from Bloomberg
Looking across the spectrum of ‘risk’ assets, there isn’t a combination of breadth and intensity I usually look for when evaluating the market’s appetite to forge system-sweeping trends. The S&P 500 was little change, the emerging market ETF I follow (EEM) was up and crude oil (as risk asset and growth measure) slid. That is a mixed bag. Yet, among these various modest moves, there were a few very intense markets to take note of from a sentiment perspective. Without doubt, the most prominent asset class for volatility this past session was the cryptocurrency market. Bitcoin dropped -11 percent Tuesday but was down as much as -19 percent through the trough of the session. Ethereum and Ripple were suffering even steeper losses and the asset type overall was taking a hit. I don’t believe this collapse was the result of the news that El Salvador had officially adopted Bitcoin as a national currency, but the ‘sell the rumor’ aspect didn’t help. Such ‘flash crash’ like volatility is not uncommon in this still-heavily speculative asset; and where goes the biggest players (like BTC), so goes the rest of the market. While many extol the virtues of cryptocurrency’s future, it is still principally a speculative vehicle for the masses.
Chart of Bitcoin, Ethereum and Ripple Relative 1-Day Performance (10 Min)
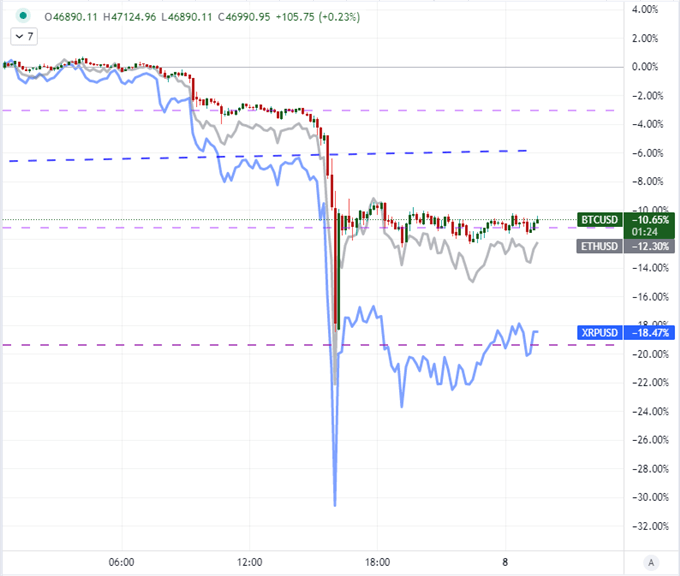
Chart Created on Tradingview Platform
Remember How Exposed We Are
The markets can remain irrational longer than you can remain solvent. That is the most common version of a statement made by economist John Maynard Keynes. In practical terms, I see that as a reminder that we may not agree to the broader market’s view on the circumstances and the future; but it does little good to be ‘right’ when it can still leave you on the wrong side of market movement. Though I hold my personal convictions on fair value and practical assessment, my general creedo is to trade what is in front of us while having a plan should that cloud of conviction break. A good reminder of this situation for me is the current ratio of the Nasdaq 100 to Dow Jones Industrial Average. We pushed the comparison even further to more than two decade highs Tuesday and are in territory not seen since the absolute peak of the Dot-Com boom/bust back in 2000. I began my own trading not very long before that point. I learned a lot of around that incredible upheaval and the aforementioned lessons are just a few of the points.
Chart of Nasdaq to Dow Jones Industrial Average Ratio with 50-Month SMA (Monthly)
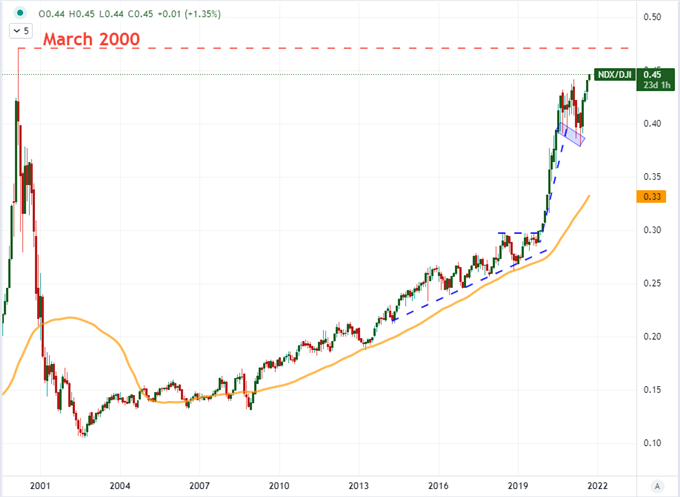
Chart Created on Tradingview Platform
Another look at the excess in the market is the degree of leverage the market is bearing in notional terms rather than simply the thematic. Below, is the scale of ‘leverage’ used at the investor level via the NYSE. It should come as no surprise that the market’s charge and the extremely low cost of funds has driven the use of borrowed funds to such heights. What is even more concerning for me is the conceptual use of leverage across all economic participant groups: consumer, businesses, government and central banks. The scale of debt severely amplifies the risk of losses should the market’s turn against the underlying positioning.
Chart of S&P 500 Overlaid with NYSE Client ‘Leverage’ (Monthly)
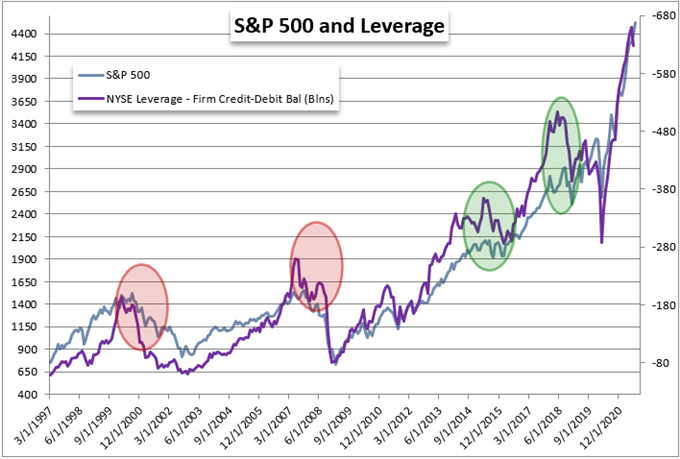
Chart Created on Tradingview Platform
Monetary Policy the Scheduled Theme
Moving from the abstract to the scheduled event risk, this week’s most prominent theme from the economic docket is the focus on monetary policy. We are two weeks out from the Federal Reserve’s next monetary policy announcement (with updated forecasts), but there is plenty of central bank fodder for the time being. This past session, it was the Reserve Bank of Australia (RBA) that gave the most recent change. While the central bank held its benchmark rate and 3-year government bond yield target at 0.10 percent, it would still reduce its weekly bond purchases from A$5 billion to A$4 billion. That move would seem to contradict the drop from AUDUSD and the Australian Dollar at large. Yet, when we consider the market expected this move and was instead surprised by the shift for the next reduction from November to February of next year, there was a dovish shift relative to expectations.
Chart of Central Bank Relative Monetary Policy Perception
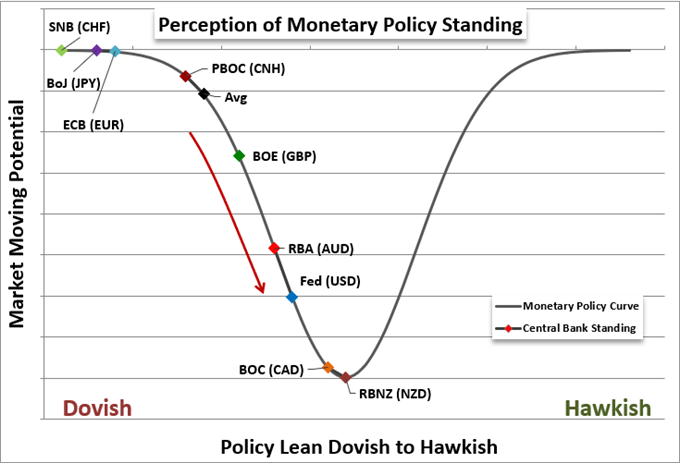
Chart Created by John Kicklighter
Looking further ahead, the top central bank decision on my radar for this week is the Thursday’s European Central Bank (ECB) rate decision. With the Euro’s rally these past few weeks, there has been a growing interpretation from the speculative rank that the group was moving in on a taper decision – it seems consensus among economists was a December announcement. Yet, the group has attempted to make its dovish credentials unmistakable recently including going so far as to shift its mandates to be even more loose. This contrast in market position and ECB effort looked like a contrast on EURUSD which could render a significant surprise come Thursday, one way or the other. Yet, the pullback this past session – championed by a Dollar bounce – can mute the potential.
Chart of EURUSD with 100-Period SMA (8 Hour)
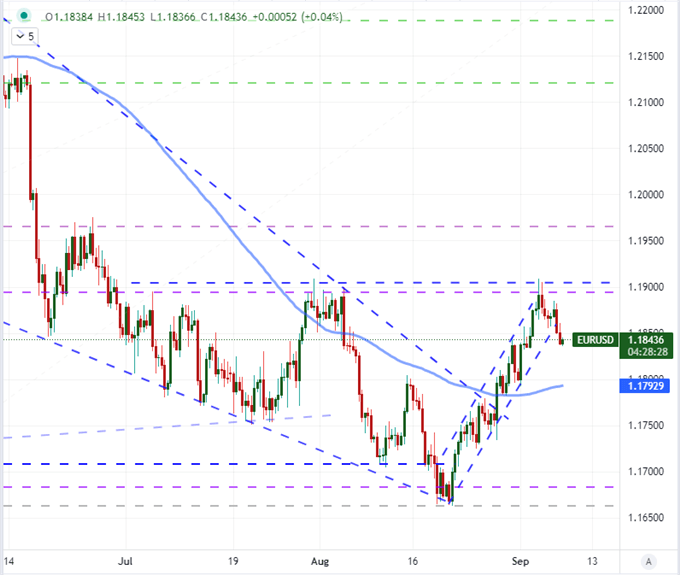
Chart Created on Tradingview Platform
For Today’s session, the Canadian Dollar is the center of attention. There are a few events on tap including the Ivey manufacturing activity report. However, the Bank of Canada (BOC) rate decision holds greater potential given its general hawkish standing relative to its major peers and given it is in the midst of a run of central bank meetings this week. USDCAD is naturally a loaded pair, but its technical layout is less than convincing and the Greenback is a difficult counterpart upon which to play off moves. I am particularly interested in NZDCAD where the Kiwi is arguably one of the most hawkish positioned majors and suppressed despite the RBNZ’s warning that a hike is ahead.
Chart of NZDCAD with 100 and 200-Day SMAs (Daily)
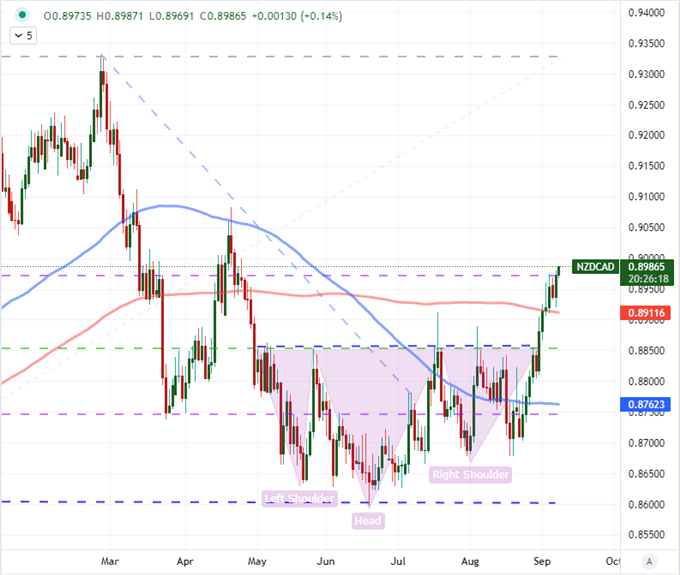
Chart Created on Tradingview Platform


