
US Treasury Yield, Dollar, USDJPY, Bitcoin, Oil and Gold Talking Points:
- After an extended holiday weekend, the Dollar enjoyed a bounce this past session which aligned neatly to the highest 10-year Treasury yield in a year
- While the S&P 500 held near record highs, other risk assets were putting up a mixed performance with Yen crosses leading the day
- Top movers to start this week are Bitcoin pushing $50,000, crude oil that is finally returned to key resistance at 60 and gold leaning on key support

A Shift in Risk Appetite
The S&P 500 and other major indices are back online following an extended three-day holiday weekend in the United States, but the additional liquidity has altered neither the bearing nor the tempo of the broader financial system. It seems the market is still awaiting a definitive spark to trigger a more systemic move – whether bullish or bearish – and the fundamental conviction seems to simply elude the masses. Talk of stimulus continues to fuel speculative indulgence while recognition of the overreach seems to quash fresh enthusiasm before it can reestablish itself. Heading into Wednesday trade, it is worth noting the concentrated appetite in particular areas of the system like Japan’s Nikkei 225, WTI crude oil and the Yen-based carry trades. Yet these performances are far from indicative of broader conviction. Will a rotating mix of benchmarks continue to pass the mantle of bullish interests or will systemic conviction sweep the markets-at-large to a clear trend?
Chart of S&P 500 with 50-Day Mov Avg, 5-Day Historical Range and COT (Daily)
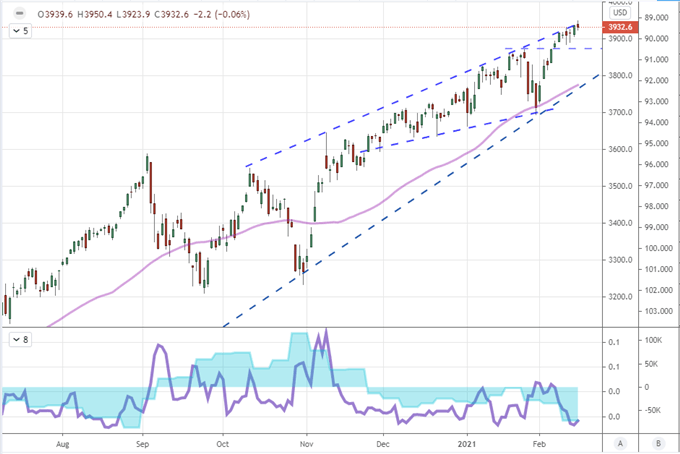
Chart Created on Tradingview Platform
From the benchmark S&P 500, I will note that that net speculative futures positioning behind the market is the most heavily short it has been since late August and the 5-day historical range (as a percentage of spot) is the most constrained since the same period. The latter measure suggests a break to broader the range is soon at hand while the former insinuates a bearish resolution. Normalizing market activity is a more statistical probability, but direction is dependent on the circumstances at any given moment in time. It is worth noting, however, that the SPY SPDR ETF – the most heavily traded exchange traded product (ETP) – was actually registering in the WallStreetBets reddit board after Palantir which reported earnings and GameStop which remains a sore spot for ‘diamond hands’.
Read about how the rise retail can be a signal for a market mania.
Chart of Top WallStreetBets Reddit Board Mentions (Minute)
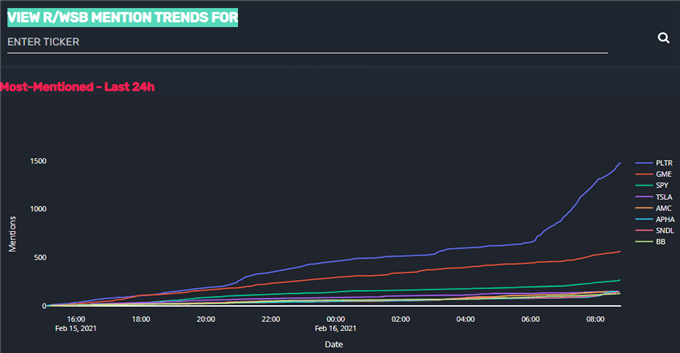
Chart from Quiver Quantitative
Where the heavily shorted US stocks and top liquidity cannabis shares have retreated from the spotlight, there are other risk measures that have rotated in to take their spot. Most interesting for me given the context of its performance relative to other markets these past years is the charge in the Yen-based pairs. USDJPY has pulled extended its bounce off of former resistance in the 100-day moving average to crest 106. While the Dollar’s bounce certainly played a role here, the JPY crosses were broadly higher with more significant advance to higher level figures for the likes of EURJPY, GBPJPY and AUDJPY. This is an unusual channel for sentiment given the lack of enthusiasm among FX – much less more macro – traders as of late. Perhaps this reflects on an appetite for yield.
Chart of USDJPY with 100-Day Moving Average (Daily)
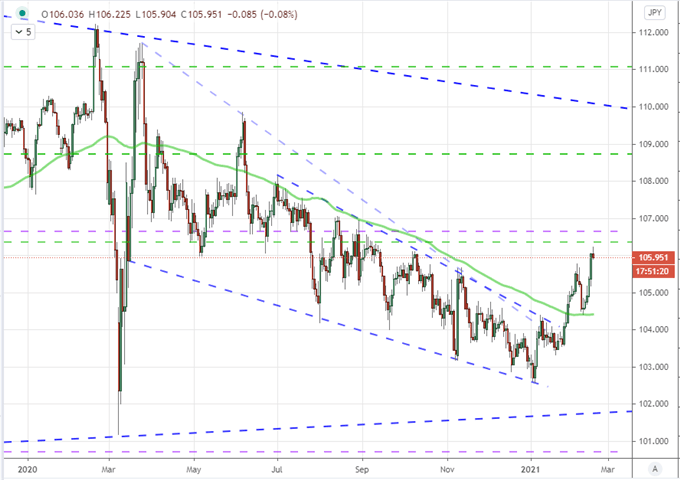
Chart Created on Tradingview Platform
The Charge in US Yields
It would be more than a stretch to suggest that yields to be found in the open market are promising. With the flood of central bank and government accommodation, a market awash in liquidity has driven the rates of return in the financial system to the floor. This has fundamentally altered the nature of the capital markets and dangerously fueled a complacency-led appetite for exposure to compensate for the serious lack of income or passive returns that many would often pursue. A rebound in market returns born from growth are likely some ways off into the future, but there are less planned pressures that can alter that landscape. Notably, this week has seen a renewed rally in US 10-year (medium-term) Treasury yields. This is likely to a side effect of inflation expectations along with growth prospect. There are just as many risks posed by this development as promise, so market participants would do well to watch closely.
Chart of 10-Year US Treasury Yield (Daily)
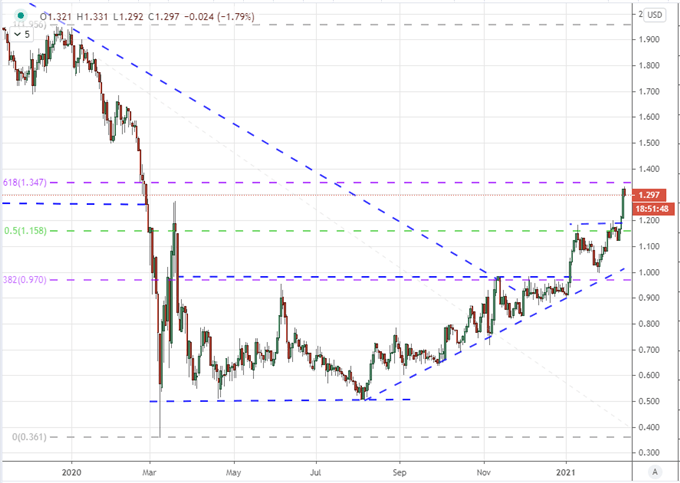
Chart Created on Tradingview Platform
Speaking of inflation expectations, there are side effects of taking a very aggressive accommodation stance. The abundance of liquidity can in turn drive the prices for goods to exceptional highs as a larger money supply chases a measure of goods and services that cannot growth to keep pace. Looking at the market’s view of price pressures, the so-called 5-year breakeven rate used to evaluate forward inflation in the United States rose to its highest level since September 2012. The question is whether the Fed and other authorities even acknowledge this climb and whether there is relative performance aspects to be derived from the pressure.
Chart of US 5-Year Breakeven Inflation Rate (Daily)
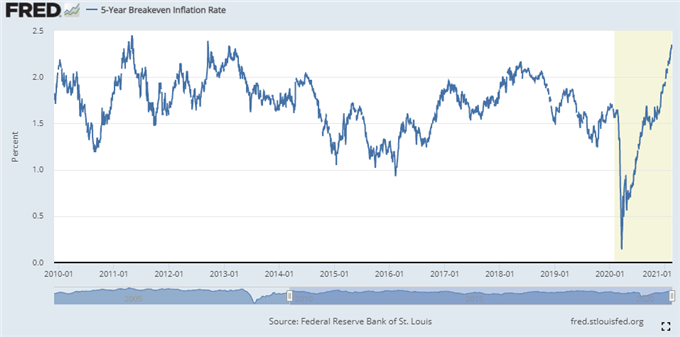
Chart Created on St Louis Federal Economic Database
Looking across the Dollar based majors, there was a noticeable jump for the Greenback; yet there weren’t many decisive moves that would spell the beginning or resumption of trend. USDJPY was one of the few pairs that present an open technical move, but the more liquid EURUSD merely rejected resistance (the long-term Fib and 100-day moving average at 1.2150) while GBPJPY is still tethered to its multi-year high. Given the reticence for conviction behind the currency, I’m more interested in the picture being drawn by NZDUSD. In a terminal wedge (meaning it is running out of room) and a 25-day trading range that is comparable to August 2018 – and before that not since 2014 – a break seems inevitable. Of course direction and momentum at the point of ignition depend on what causes the spark.
| Change in | Longs | Shorts | OI |
| Daily | 6% | -5% | 1% |
| Weekly | -25% | 38% | -7% |
Chart of NZDUSD with 25-Day Historical Range as Percentage of Spot (Daily)
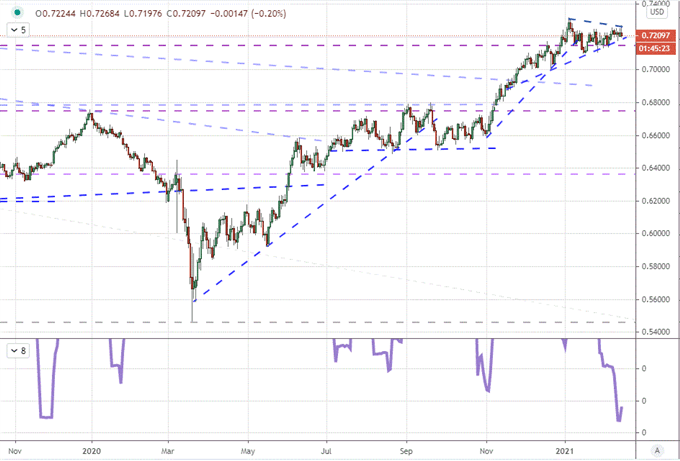
Chart Created on Tradingview Platform
Commodities Start to Generate Some Serious Interest and Volatility of Their Own
Perhaps a side effect of the same inflation pressures rousing the Dollar and/or the relentless bid behind US indices, gold has leaned more heavily into support this past session. The commodity slipped $1,800 Tuesday and threatened to slip trendline support and the overlap of Fibonacci levels that few technicians would miss. Is this acting the role of a safe haven, an alternative to fiat or simply a preferred alternative to the US Dollar? That remains unclear, but I would expect one of these roles to be taken up in the event of a committed move.
Chart of Gold with 50-Day Moving Average and Volume (Daily)
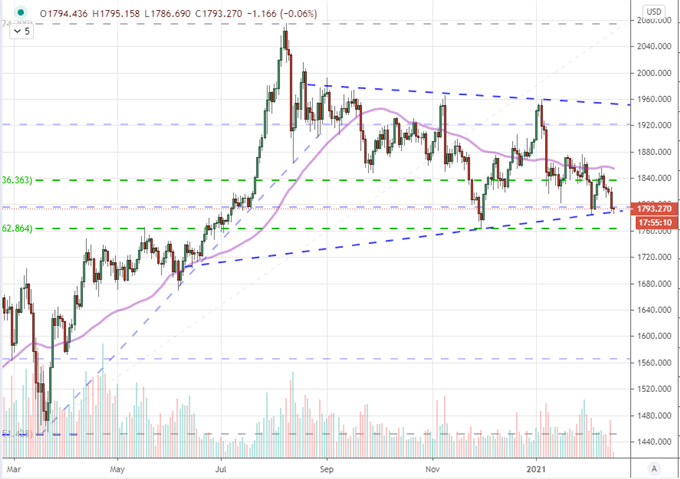
Chart Created on Tradingview Platform
As for crude oil, I see a market that is more aligned to economic potential. The commodity – specifically the US-based benchmark WTI – jumped in the first trading day of the week Tuesday. This added lift edged the market to an intraday high that leveled the market up to a more-than-16 percent gain on the month of February. Further, this is an extended recovery from the worst rout for this commodity on modern record when circumstance saw it unexpectedly flip negative last April. From the intraday low back on April 20th, we are up over $100 per barrel. There is a significant level of coasting to this market, but with substantial technical resistance starting to come into view, something more fundamental will likely be needed to keep the markets backed by lift. This is a market worth watching for a macro perspective on the evaluation of global growth going forward.
Chart of WTI US Crude Oil Futures with Net Speculative Futures Positioning (Weekly)
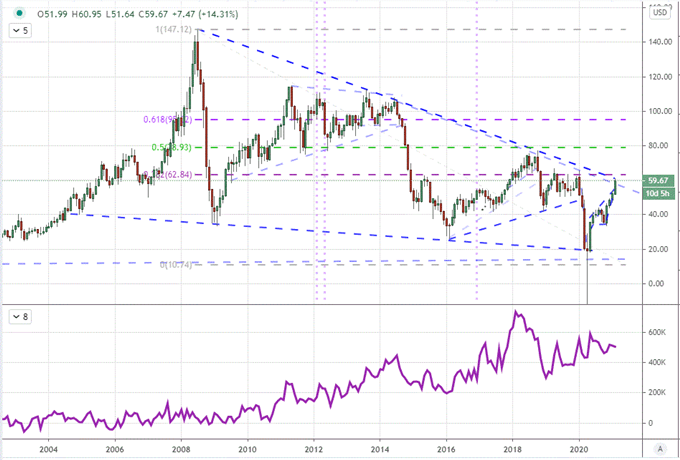
Chart Created on Tradingview Platform

.