


S&P 500, Dollar, EURUSD Points:
- Despite the dying light in liquidity, the major US indices put in for a provocative short-term break to close this week – a H&S pattern for the Nasdaq and 200-day average for S&P 500
- While recession, financial health and stimulus’s capacity to keep ahead of troubles are key themes; my top concern remains the resurgence of the pandemic spread
- In event risk, the week ahead includes a broad range of data and holiday-truncated liquidity; but Thursday US NFPs may still represent a top listing
Some Speculative Drama to End the Week and Start the Next
Had speculative trends held their course through the very end of the week, we could have closed out the period with a very innocuous congestion for the likes of the Dow and S&P 500 to start off next week. Instead a (bearish) break to close out Friday has raised the profile in what lies ahead significantly. Is the market finally ready to account for the IMF’s sharp downgrade of the recession forecast, the central banks’ flagging ability to offset value shortfalls or return of the coronavirus curve? Or is this yet another false break that will be reined back in by complacency?
Taking the technical temperature, my preferred – though very imperfect – one-look measure of risk appetite, the S&P 500, slid below its 200-day moving average to close this week. This move would also clear the floor of a three-month rising trend channel, but it is he moving average that would make it onto the headlines of papers that otherwise wouldn’t even acknowledge a chart. The even 3,000 level is another milestone that all market participants would be aware of should it fall.
| Change in | Longs | Shorts | OI |
| Daily | 1% | -1% | 0% |
| Weekly | 15% | -13% | -1% |
Chart of the S&P 500 with 50 and 200-Day Moving Average and 50-Day Disparity (Daily Chart)
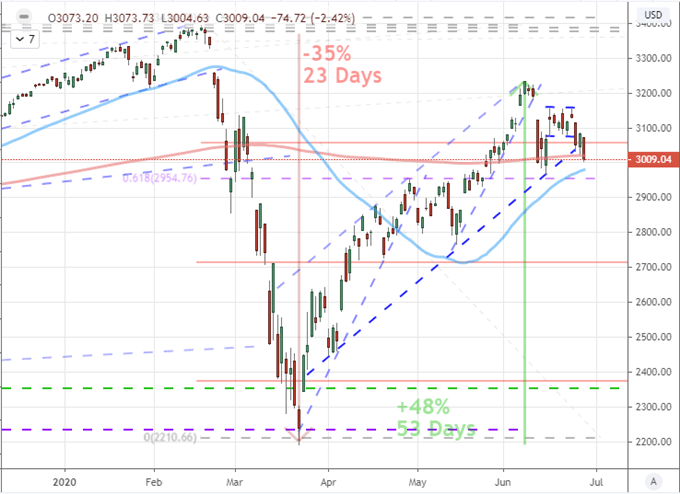
Chart Created on Tradingview Platform
While usually grouped in the same category as the S&P 500, the Nasdaq 100 deserves specific consideration. The tech-heavy index signaled a break below support that stretches back nearly two weeks. I recognize the 9,900 level however better as a ‘neckline’ on a head-and-shoulder pattern. These can reflect upon price-based intention of mounting a reversal. What is more remarkable about this progression though is that the tech sector has been the focal point of speculative appetite as concentration within out performing US equities among other asset leaders. FAANG members (Facebook, Apple, Amazon, Netflix, Google) have also earned an acutely steep retracement of their own. It seems that the ‘moral hazard’ earned complacency may be in serious upheaval…if it carries into the new week.
Chart of the Nasdaq 100 Overlaid with FAANG Index (2-Hour Chart)
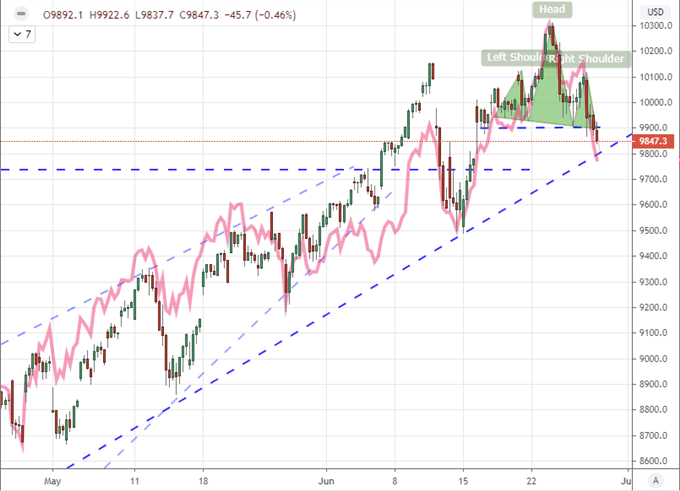
Chart Created on Tradingview Platform
The Overriding Fundamental Themes
Looking ahead to the new trading week, there is plenty on the economic docket to distract ourselves with, but it is far more likely that systemic matters will draw the collective scrutiny. The IMF reiterated the pain of recession and the Fed’s bank stress tests reminded us of monetary policy influences this past week without the full payoff of speculative response. The resurgence of the coronavirus on the other hand drew even the diehard optimists’ attention. It may be a function of coverage, but the situation in the United States leveraged far more intensive concern. The number of positive cases in the world’s largest country hit a record high with reports that states like Texas was fully reversing its decision to reopen.
Graph of US Cases of Coronavirus (Daily)
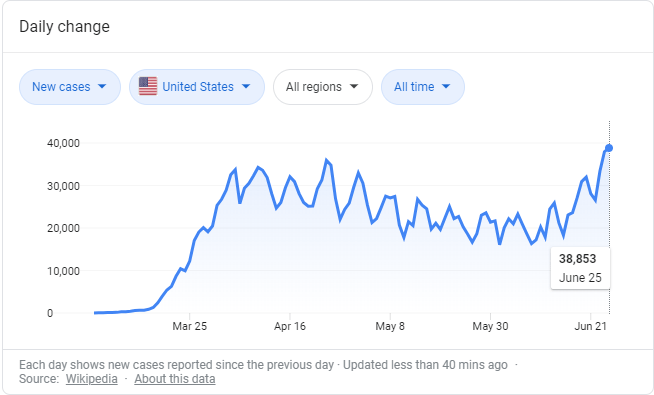
Chart from Google with Data from Wikipedia
While the United States may be drawing a disproportionate amount of attention for its COVID-19 situation, it is important to remember that this is a global matter. Cases worldwide are just off a record and countries like Germany, Italy and Brazil among others are attempting to walk the fine line to recovery from their self-imposed severe recessions without reviving a health crisis. As this pressure builds, we will see issues like trade trains suffer. We have already seen USDCNH and EURUSD hit by fresh trade war threats these past few weeks. That is likely to only grow more problematic as the economic strain increases.
Graph of Worldwide Cases of Coronavirus (Daily)
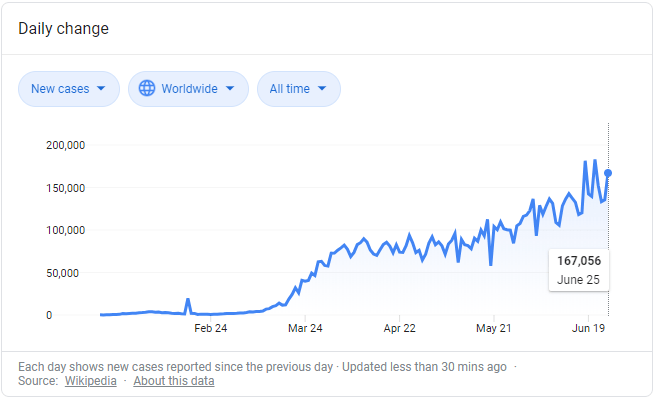
Chart from Google with Data from Wikipedia
Relative Risk and the Run of Scheduled Event Risk
As the health crisis returns to the headlines, there is a systemic quality to its impact – whether there is a federal response that forces economic restriction or a consumer/business self-motivated rejoinder. One aspect of this situation to keep tabs on is the relative pain afforded to the US relative to the rest of world. While there is debate as to the situation of the resurgence in cases in the US relative to the globe, the headline coverage insures closer attention. With only a few days to go to June 30th, the performance of the US markets (S&P 500) has seen its biggest monthly drop relative to rest of world (VEU) since 2009.
Chart of S&P 500-VEU Ratio Over S&P 500 Index (Monthly)
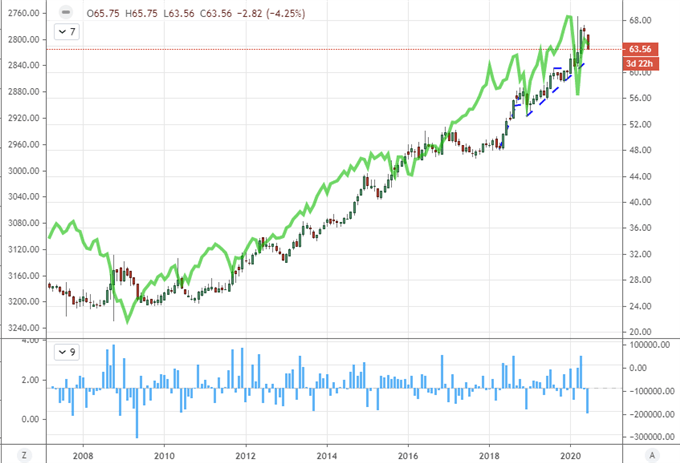
Chart Created by John Kicklighter with Data from Bloomberg
Of course, regional equity performance isn’t the only consideration to relative fundamental imbalance. The Dollar is a lightning rod of its own. Recently, the Greenback has stood as a remarkably sensitive safe haven when comparing its course relative to the likes of the S&P 500. That is a change from previous months and years where the currency took on more of a carry currency role and would otherwise only revert to a haven when absolute liquidity was the guiding principal. Will this haven status hold fast should the disproportionate focus on US COVID cases relative to the rest of the world – along the growth and trade war implications that draws – into the future? That is a matter to keep close tabs on. So too is the scheduled event risk topping the calendar from June NFPs to the Conference Board’s consumer confidence survey to the ISM’s manufacturing activity report.
Chart of Google Search Ranking for ‘Second Week’ (Weekly)
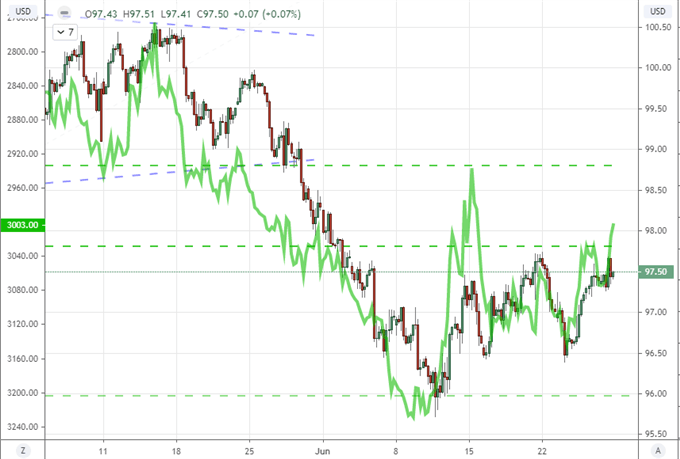
Chart Created on Google Trends

If you want to download my Manic-Crisis calendar, you can find the updated file here.
.


