


Dollar, Apple, Dow, S&P 500 Talking Points:
- New coronavirus cases hit a record high through Friday morning and the news could have been breezed over if not for Apple’s announced store closures reminding of a clear connection
- Recession reminders have been a constant and will continue to be going forward – including the Fed’s bank stress test which is weighing ‘V’, ‘U’ and ‘W-shaped’ recovery scenarios
- Stories of retail trader largesse abound at present, and tuned in market participants would do well to recognize the risks of this incredible, careless attitude
Even the Optimists are Aware of the Irrational Exuberance
On a week-over-week basis, the markets closed this past Friday modestly higher. However, those that were trading through the period walked away with a very different impression as the Dow and S&P 500 slid through Friday and struggled for any measure of conviction Tuesday’s gap on. I am particularly mindful of the systemic distortions that have pushed sentiment to a status of bald-faced moral hazard, but the more overt draws on confidence are starting to present problems of their own as well. The threat of a second wave of the pandemic has grown measurably the past few weeks, but investors have happily overlooked the risk as the tangible impact on the economy wasn’t clear…until now. On Friday, the world’s largest public company by market capitalization, Apple, announced that it was closing 11 of its stores in states currently experiencing a rise in coronavirus cases. Even if the White House has little interest in instituting a Federal shutdown in the event of an second wave, American consumers and businesses may do it themselves.
| Change in | Longs | Shorts | OI |
| Daily | -18% | 18% | 7% |
| Weekly | -19% | 14% | 4% |
Chart of the Dow Index Overlaid with Apple (Daily Chart)
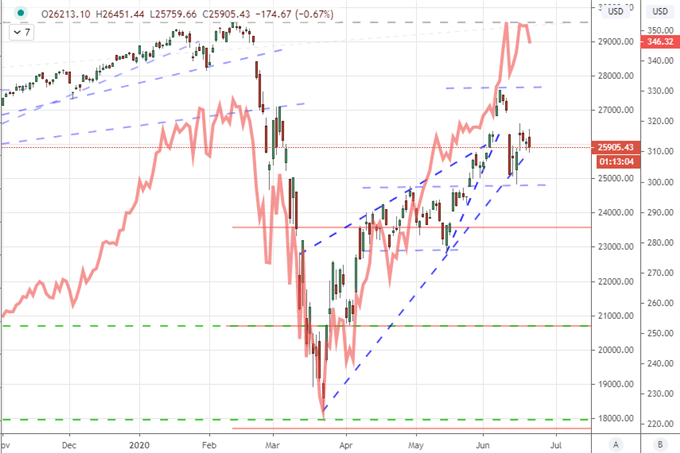
Chart Created on Tradingview Platform
In a forward looking, the risk of volatility can arise as often from the market’s own over-zealous projections than the inevitable, unfavorable developments that come to pass. At present, speculative excess is echoing across the financial headlines. In addition to the highest rate of search for the term ‘bubble’ in four and a half years, the stories of inexperienced traders crowding into the markets (and boasting of the ease of this new endeavor) while gurus with just as little experience are pulling tiles out of a Scrabble bag as a filter for stock tickers. Such tales of extravagance don’t necessarily indicate an imminent collapse, but in such an environment it is important to be mindful of warning signs. Just such a signal may have been flashed through the close on Friday when speculative unwind kicked in after the close of the cash market. There is a brief period between the close of the spot and futures market. In that time, the S&P 500 (via the emini) dropped approximately 40 more handles – the third biggest bearish divergence I have on records. Be wary Monday.
Chart of the S&P 500 Overlaid with Emini-Spot Close Difference (Daily Chart)
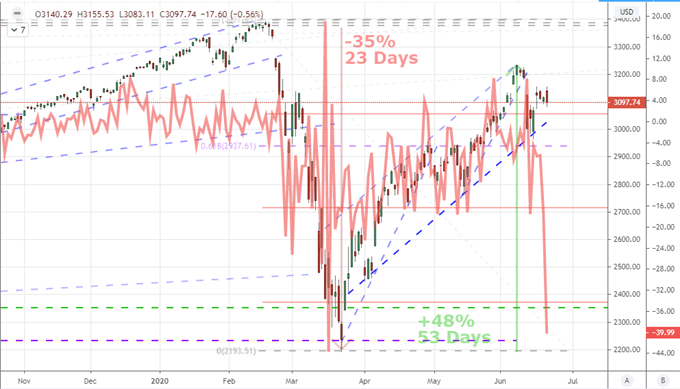
Chart Created on Tradingview Platform
Having a Haven In Mind Just In Case
Just because there is a listing in risk benchmarks doesn’t mean we are already destined for a full unwind when liquidity returns. Nevertheless, I like to be prepared. Should deleveraging gain traction in the week ahead, there are a few havens on my list which I intend to turn. Gold maintains an appeal of a traditional haven that also benefits from the depreciation in traditional currencies under extreme monetary policy programs. That said, the Dollar has shown itself to be particularly aligned to even moderate swings in sentiment lately. The correlation between the S&P 500 and DXY Dollar Index on shorter time frames (such as 4 hour charts) is particularly remarkable.
Chart of DXY Dollar Index Overlaid with an Inverted Scale S&P 500 (4 Hour)
Chart Created on Tradingview Platform
To offer some contrast to this latent potential, the net speculative futures positioning update from the CFTC’s Commitment of Traders report Friday show the biggest drop in net long interest for the Greenback since June 2012. There is a notable contrast between the bearings of the currency and positioning which is not unheard of given the historical picture. What’s more, extreme positioning has more often resolved to the underlying market. If you are watching the single currency, keep tabs on EURUSD, GBPUSD, AUDUSD and NZDUSD.
Chart of DXY Dollar Index Overlaid with Net Speculative Dollar Futures Positioning

Chart Created by John Kicklighter with Data from Bloomberg
Top Scheduled Event Risk – And Markets – For Volatility
While I give greater weight to the ultimate move in markets as the underlying bias shifts, it is worthwhile keeping track of the fundamental catalysts that can overcome inertia. Though not a scheduled event, the daily tallies on the new cases of coronavirus positives in the United States and globally will likely hold considerable sway over the headlines and traders’ decision making.
Graph of Worldwide Cases of Coronavirus (Daily)

Chart from Google with Data from Wikipedia
Another theme of exceptional reach but with a little more scope for timeliness is the influence of monetary policy. There are a range of non-monetary policy meetings for a range of major players: ECB and BOE financial policy meetings, BOJ summary of opinions and SNB quarterly bulletin. As for traditional rate decision, the Reserve Bank of New Zealand (RBNZ) is on tap as are the central banks of Mexico and Turkey who are expected to serve significant cuts. The most remarkable event in this category though is the Fed’s bank stress test. Given the economic and financial conditions amid a current recession and fears over a second wave of the pandemic, this evaluation will set a critical tone.
Chart of the Major Central Banks Collective Stimulus Overlaid on S&P 500 (Monthly)

Chart Created by John Kicklighter
According to reports, the Federal Reserve will add three new scenarios to their stress test including assessments based on a ‘V-shaped’, ‘U-shaped’ and ‘W-shaped’ recovery. The circumstances of their base-case scenario and the scope of the more troubled outcomes can give scope to bearish views.
Graph of Global Search Ranking for ‘Bubble’ (Daily)

Chart from Google Trends

If you want to download my Manic-Crisis calendar, you can find the updated file here.
.


