


Dow, EURUSD, USDCNH Talking Points:
- Risk appetite exhibited a strong tailwind Friday which urged Dow and S&P 500 gaps, but truly showed its heft in lifting most risk-leaning assets
- NFPs was an obvious accelerant through Friday and anticipation is likely already riding high heading into Wednesday’s FOMC rate decision
- Meanwhile, the recession is already here – if undercounted – and the US President is leaning into trade wars which likely cues up geopolitical tensions into 2H
Risk Trends Surge with the Help of a Surprise NFP Increase
Speculative appetite ended with a surge through the end of this past week with a strong contribution made by the May US employment statistics. A surprise net increase in payrolls through last month was a stark contrast to the more than 20 million jobs lost through the month of April. With speculative appetite already on the rise, such an update would naturally amplify enthusiasm in risk-leaning assets. For the Nasdaq 100, a record high already in easy reach would be another one for the record books. The speculator favorite S&P 500 extended its rally to a 52nd day (from the March 23rd low) and hefty 46 percent. However, I am was most impressed with the technical picture from the blue-chip Dow which spurred a bullish gap when right on the cusp of the 200-day moving average. That makes quite the statement of a technical break.
Chart of the Dow Index with 200 and 50-Day Moving Averages (Daily Chart)
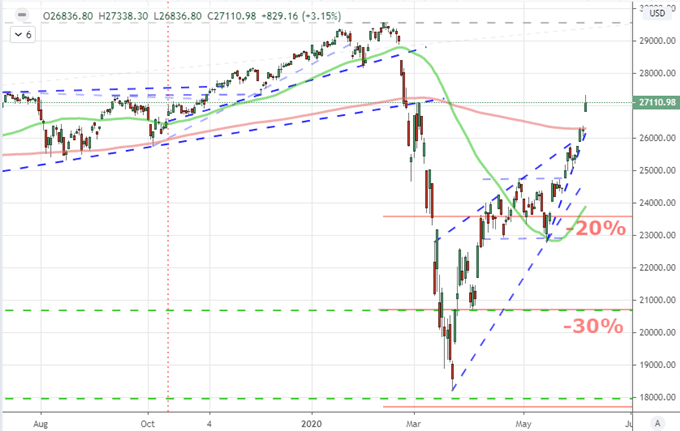
Chart Created on Tradingview Platform
For those witnessing the end-of-week charge from global risk assets, it may seem obvious that bullish sentiment is in firm control of the financial system. Yet, there is sound debate to be had on the point. Speculative appetite has frequently run astray of traditional measures of value in the past given its forward looking nature and the prioritization that is distorted by crowds. However, a firm ground in fundamental backing is important when speculative appetite loses conviction in its own virtue. While momentum is a familiar sight of late, just a few weeks ago, the instance of false-break-reversals was the norm. Nearing or breaking record highs will raise awareness of conviction substantially – and few would like the results of a full introspection now.
| Change in | Longs | Shorts | OI |
| Daily | 1% | -1% | 0% |
| Weekly | 15% | -13% | -1% |
Twitter Poll of S&P 500 Bull or Bear Market
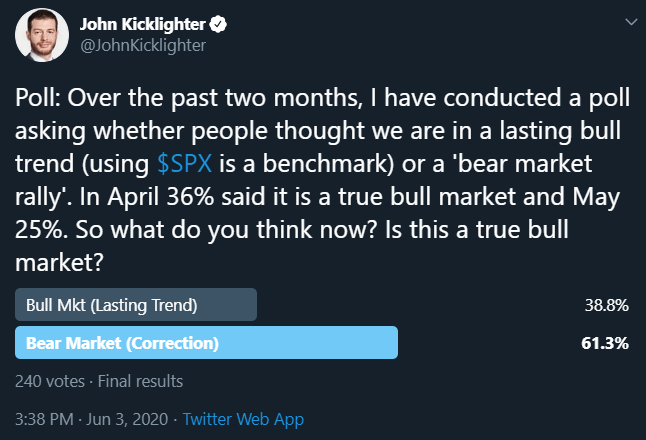
Poll from Twitter, @johnkicklighter
For those trying to make a case out of a fundamental shift in the backdrop of the markets to spur a more traditional backdrop of risk appetite, I’d urge taking a closer look at the data. On Friday, the United States reported an unexpected 2.5 million jobs added to the economy. That was against a forecast of 8 million jobs lost and following April’s more than 20 million decrease in payrolls. Given those kind of expectations, that was a remarkable outcome. Yet, where the advantage was truly realized is that a better-than-expected outcome aligned to existing investor optimism and greater awareness for data that reinforced that bias. Yet, just as it is important to consider sentiment as we venture towards or surpass record highs, it is worth considering how any more of those extraordinary net increases in payrolls it would take to wipe out the recession-driven reduction in employment.
Chart of US Nonfarm Payrolls Change and Totals (Monthly)
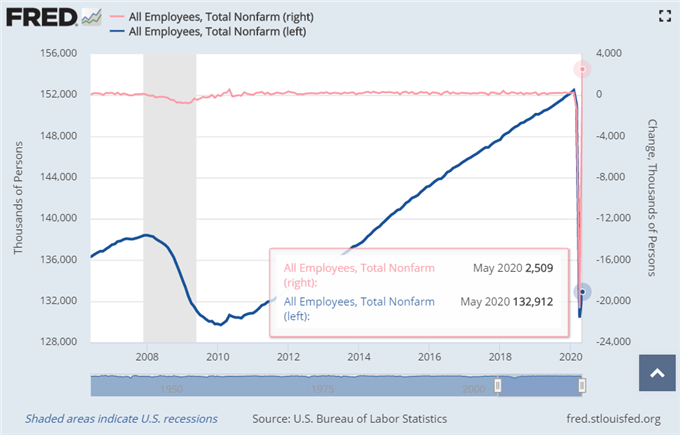
Chart Created on Federal Reserve Economic Database
The Fundamental Issues Remain and Trade Wars Remains a Pressing Concern
For systemic themes heading into next week, there are a host of issues that I will be keeping close track of. First and foremost, the overview of recession is a matter that I believe will eventually cut optimism off at the knees, but there is little clarity on when event risk will make this explicit. Meanwhile, the risk of a second wave in the pandemic should be a front-of-mind concern. The reopening of the global economy is an uncertain risk, even if there is a room for argument that the need offsets the risk. Between the capital market strength and economic struggle, there is an administration that is facing re-election with a steep recession and considerable political strains. It is therefore of little surprise that trade wars have been rekindled. Yet, without fresh sanction or tariff this past week, USDCNH seemed to follow the path of least ‘risk’ resistance.
Chart of USDCNH with 50-Day Moving Average (Daily)
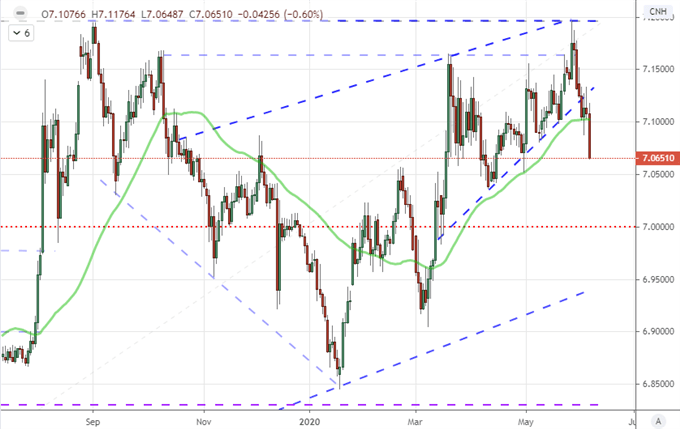
Chart Created on Tradingview Platform
Yet, not all was quiet on the trade front. President Trump heading into the close Friday revived the frontier of trade wars from 2019 when he once again threatened to raise sanction on the country’s biggest developed world counterpart: the European Union. Referencing a lobster tariff, the President warned that he could move forward with import taxes on European autos – an option that was conspicuously passed over without word when the Section 232 deadline was passed last year. With EURUSD only finally breaking an 8-day rally on Friday, that is quite the threat.
| Change in | Longs | Shorts | OI |
| Daily | -1% | -4% | -3% |
| Weekly | 4% | -10% | -5% |
Chart of EURUSD with Equally-Weighted Euro Index and Consecutive Candle Count (Daily)
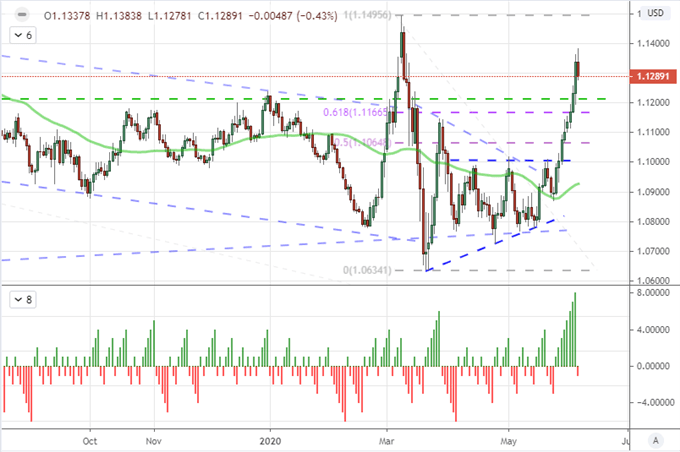
Chart Created on Tradingview Platform
Among the Event Risk Ahead: The FOMC Rate Decision (With Forecasts)
Speaking of economic disconnect, the US economy is almost certainly facing a recession of incredible performance, but we won’t verify that until the second quarter GDP figures are released in late July. At that time, we will be deep in the election cycle and voters will no doubt be considering the state of the economy and their own financial position. Even if the circumstances for the downturn were not fully in the government’s control and policy can do only so much in turning the tide in an expedited fashion, history suggests the judgement will land at the polls. That said, efforts to improve the local economic performance quickly will be top of mind. Recovery at that pace cannot come without sacrifice, so it is not surprising that such sacrifice may come at the expense of trade partners.
Chart of Change in US GDP and the Logarithmic Wilshire 5000 Index Chart (Monthly)
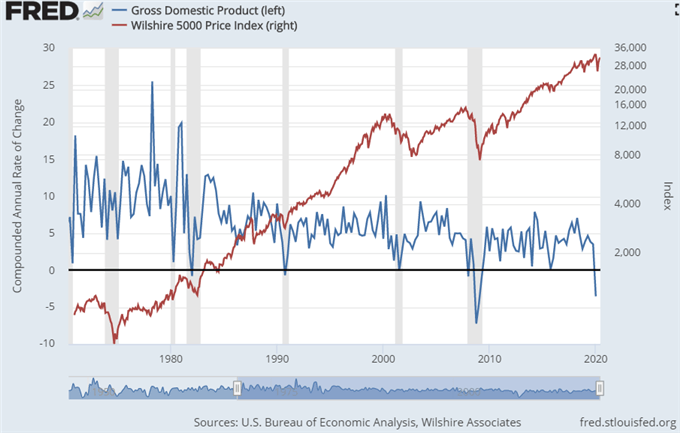
Chart Created on Federal Reserve Economic Database
Another frequent source of enthusiasm and growth (if more in forecast than realized expansion) is monetary policy. Thus stands the FOMC rate decision on Wednesday. This gathering of officials at the world’s largest central bank is my top fundamental listing ahead. What can the Fed do? What are they willing to do? Looking to Fed Fund futures, the expectation of negative rates has actually vanished. Yet, with the ECB’s stimulus escalation, there is some anticipation of more support – even if it would come with questionable weight. This is one of the quarterly events that has normally come with updated forecasts, but it is not certain the Fed will hold to that norm. Keep this one clearly marked on your calendar.
Chart of Dow Index and Fed Funds Futures Contract for Dec 2021 (Daily)
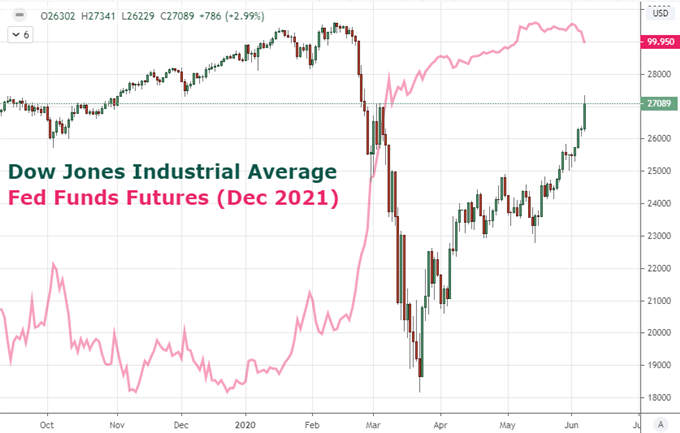
Chart Created on Tradingview Platform

If you want to download my Manic-Crisis calendar, you can find the updated file here.
.


