
S&P 500, Dow, USDCNH Talking Points:
- Recession signals received another painful update to end this week between record US retail sales decline, a Eurozone 1Q GDP recession and run of Chinese data
- While both economic-oriented data and central banker testimony will be tangible event risk ahead, my top concern will be the souring US-China relation
- Meanwhile, market conditions continue to cut technical breakouts short and neuter event risk before trends can even catch traction
Risk Trends Steady…Despite Technical Trips and Fundamental Pain
We closed out this past week with an unsteady footing in risk trends, but that more impresses than disappoints me. Taking a look at the fundamental and technical backdrop that we were presented with, seeing the S&P 500 hold fast above 2,800 and the Dow bounce back from 23,000 suggests a serious level of resiliency. On the technical side, the cues for a technical break were clearly at in place with the former index leading its speculative peers with a break below its 20-day moving average, then the ‘neckline’ of a head-and-shoulders pattern followed by a morning session dive below the mid-point of the February-March avalanche. Even non-technicians can appreciate the visibility of such a situation and speculative groundswell it could prompt.
Chart of S&P 500 Overlaid with 2-Year US Treasury Yield (Daily)
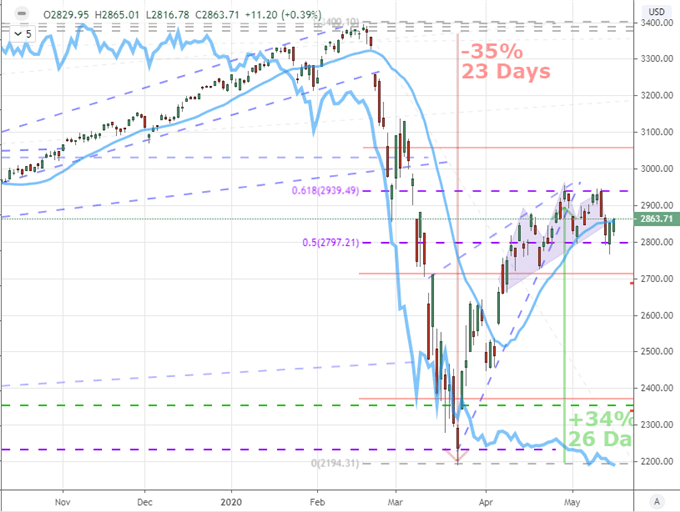
Chart Created on Tradingview Platform
Then there is the fundamental side of the equation. Not only did leaders to some of the world’s largest central banks rebuff the call for negative rates – the Fed, Bank of England and Bank of Japan – but the signals of recession continued to burn a brighter hue of red. Through the end of this past week, the Eurozone’s 1Q GDP confirmed recession, US retail sales reported a record-breaking -16.4 percent contraction and China’s April figures maintained an uneven picture of struggle. Not only are the market’s proving remarkably resilient to fresh displays of economic retrenchment, but they do so at remarkably ‘rich’ levels. I believe this is a picture of complacency and moral hazard that has put more investors in a holding pattern. Yet, climbing this high with a smaller safety net carries inevitable and significant consequences – that said, it doesn’t have to fall back to reality in just the next week.

Chart of Relative Performance for SPX, VEU, EEM, USDJPY, HYG to March 2009 (Daily)
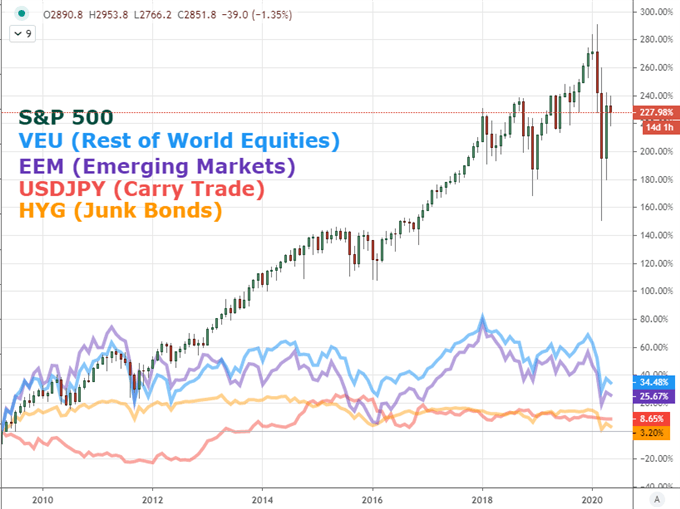
Chart Created on Tradingview Platform
The US-China Relationship Returns to the Foreground
If there were one fundamental spark that represents the greatest possible catalyst for systemic fear in the global financial system at present it would be the once-again deteriorating relationship between the US and China. And, before I touch upon that, note that I didn’t view it as a symmetrical catalyst for a bullish view. The markets are already leaning heavily in favor of risk-on despite the severe depiction of our environment. Simply seeing a less extreme recession is not really the fount for greater enthusiasm. As for the US Chinese relationship, economic contraction has revitalized protectionist policies.
While many would chalk up President Trump’s rhetoric about considering fully cutting off trade with China (and somehow saving $500 billion for the economy) to bombast, there are tangible moves being made to degrade trade relations further. The administration blocked Huawei from global chip suppliers and then announced Taiwan TSMC was going to open a factory in the United States. In response, it has been reported through Chinese media that they are considering putting some of the country’s key companies (Qualcomm, Apple, Boeing) on an unreliable entities list. This all comes before the so-called ‘Two Sessions’ meeting by the Chinese government which will no doubt touch upon foreign relations and trade.
| Change in | Longs | Shorts | OI |
| Daily | 5% | -7% | 2% |
| Weekly | 4% | -16% | -3% |
Chart of AUDUSD Overlaid with CNHUSD in Red (Daily)
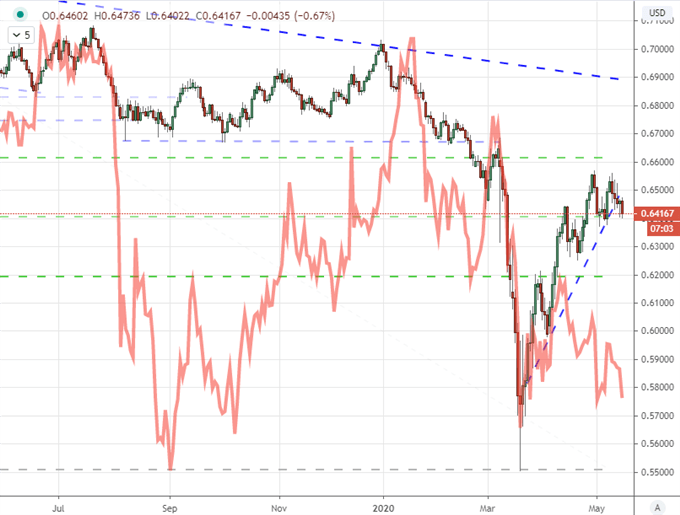
Chart Created on Tradingview Platform
Still Playing the Fundamental Standards
The global markets may seem all but disconnected from the economic and financial winds, but that is not a disconnect that it would be wise to assume will hold forever. Fundamental conditions are so severe and speculative bearing so far off a standard valuation model that the risk of market participants suddenly paying attention is far greater than the benefit of the opposite – a slow crawl aloofness. With that in mind, I will keep focus on recession signals in the coming week. This past week, the Atlanta Fed’s GDP forecast model put the country on pace for a staggering -42.8 percent contraction. We can check that against a respected piece of timely data in the Markit’s flash PMI figures for the US – not to mention Australia, Japan, the UK and Europe. That Thursday and Friday run will be important to watch.
Chart of US GDP Forecast from Atlanta Fed GDPNow Model (Daily)
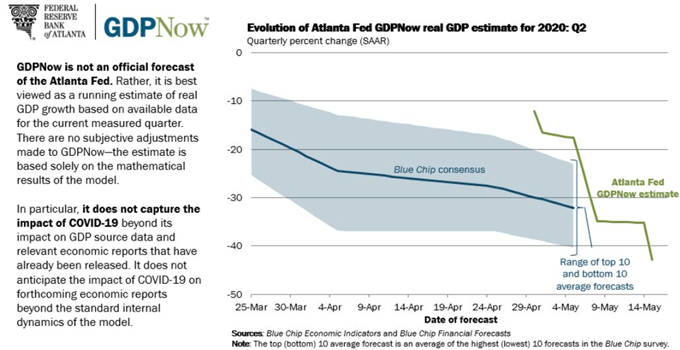
Chart from Atlanta Federal Reserve Website
The shift in position by the world’s central banks to represent a bottomless purse for funding growth and investment is also of significant importance. There is strong long-term (10-year) correlation between the level of stimulus and the performance of capital benchmarks and I don’t think that is mere coincidence. Last week’s unified stance against negative rates will likely be tested by Presidential tweets as well as the testimony on deck. Both Fed Chairman Powell will testify to Congress and BoE Governor Bailey will speak before the Treasury Committee. Speaking of GBPUSD, the pair finally saw a break of its month-and-a-half long range to end this past week, but not on stimulus rejection. Trade conversations between the UK and EU ended reportedly with little-to-no progress. It seems old issues – in this case Brexit – are flaring up under the pressure of recession.
| Change in | Longs | Shorts | OI |
| Daily | 8% | -2% | 4% |
| Weekly | -13% | 4% | -6% |
Chart of GBPUSD with 200-Day Moving Average ( Daily)
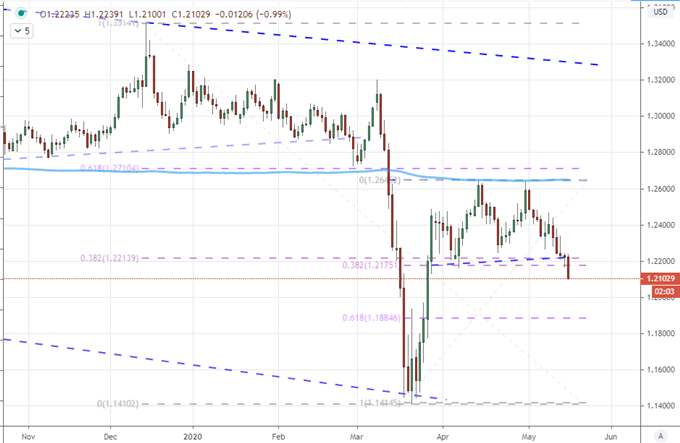
Chart Created on Tradingview Platform

If you want to download my Manic-Crisis calendar, you can find the updated file here.
.