


BrexitTalking Points:
- The S&P 500 gapped higher Friday but did little to progress recent congestion - though it did close the best quarter in a decade
- UK Prime Minister May was dealt another rejection on her Brexit proposal (344 against and 286 for), where to from here?
- If the Pound and Euro continue to slide - on themes such as monetary policy or local events like Brexit - the Dollar can break higher
See how retail traders are positioned in GBPUSD after the most recent Brexit vote failed, Gold as it forms a head-and-shoulders pattern, the Dow as it works into a decision-making wedge along with the rest of the FX majors and indices intradayusing the DailyFX speculative positioning data on the sentiment page.
Risk Trends' Strong Quarter, Modest Month, Tepid Week
Depending on what time frame you evaluate the capital markets, you could be left with a sense of extraordinary enthusiasm for a sustained risk-based charge moving forward or deeply skeptical that the bulls will retain control of the yoke for much longer. The S&P 500 is a great example of how we can change time frame to draw a different conclusion of just how robust our current market sentiment. Given that Friday was the last trading day for March, we have closed the 'first quarter 2019' candle. This high time frame that very few - even technical traders - reference stamped the strongest quarterly advance for the benchmark equity index in a December (specifically the second quarter of 2009). That is an extraordinary reference point, but not a particularly appropriate one if you intend to extrapolate where we head to from here. The scale of this remarkable three-month climb is comparable in intensity to the preceding period's collapse - a tumble that nearly qualified as a technical 'bear market', coming up just shy of a 20 percent retreat from record highs on a close-over-close basis. When we increase the frequency of historical data to see more recent pacing, it quickly becomes obvious that there is far less unchecked optimism in the markets. That is even more apparent when we compare the unique, outperforming US indices to more grounded risks assets like global equities, emerging markets, junk bonds, carry trade and government bond yields.
Chart of S&P 500 and 1-Period Rate of Change (Quarterly)
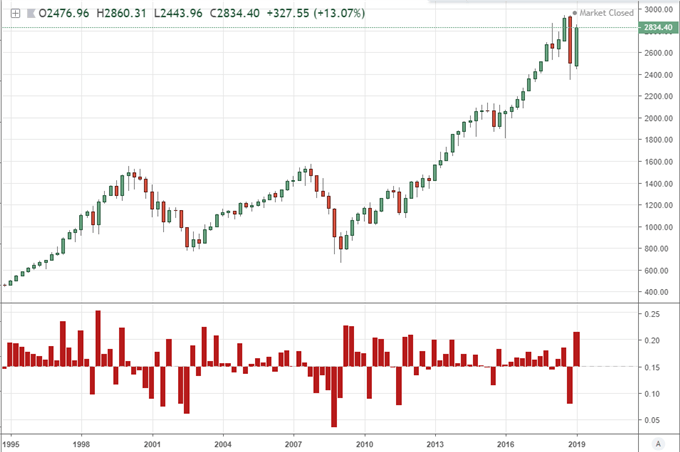
To garner genuine traction for the likes of the Dow as it attempts to forge new record highs or to simply muster enough enthusiasm to simply return so many other assets to their highs at the very start of 2018, it is critical to foster genuine conviction. That will prove difficult to achieve and such systemic influencing can work both ways. Heading into the new week, it seems like the negotiations around trade wars is being proactively promoted as a reason for enthusiasm. US and Chinese officials have voiced optimism and remarked on what they see as critical progress in their discussions to roll back tariffs on over $350 billion in goods. While that removes a threat, it doesn't exactly foster a renaissance in growth or speculative wave. Growth remains a principal concern as well. The 10-year/3-month spread in Treasury yields notably flipped positive again Friday, but that hardly absolves the fear it aroused - not that the initial signal was particularly reliable. We will now revert to tabulating the global signals from data, sentiment surveys and forecasts from various sources - a slower, uneven process for taking control. If the focus shifts back to monetary policy, we may start to register an unfavorable level of desperation that the market sniffs out quickly. This past week, White House Economics Advisor Larry Kudlow called on the Fed to cut 50 bps, but he said the economy still looked strong... Elsewhere, an OECD member warned a central bank of France crowd that if conditions soured in the Eurozone, the ECB would not have the capacity to ward off the trouble.
Another Brexit Vote Against May, The Euro and Pound Will Be Pulled in the Spider Web
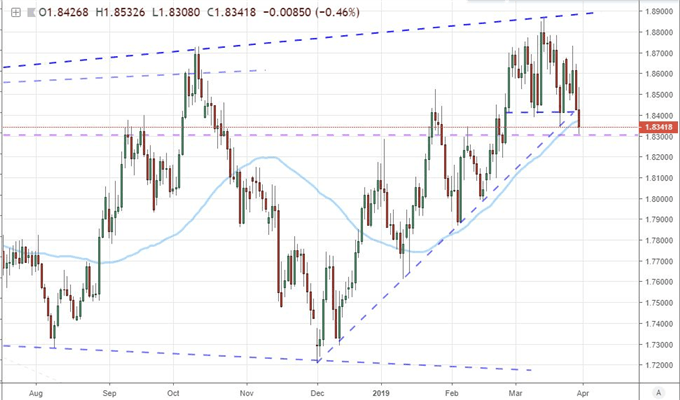
As a regional risk, the Brexit troubles are increasingly spilling over the boarders of the British Pound and UK markets. That isn't a surprise given the time to work a solution is dwindling and the possible outcomes are narrowing with the more extreme solutions seem to be gaining in probability. This past week of important votes ended with the same sense we have registered so many times over the months: no clear path forward. The government fielded Prime Minister Theresa May's Brexit proposal for a third time this past Friday, hoping that the failure of the indicative votes 8 options would warm her party to offer support. That didn't prove to be the case. In the week ahead, we have another round of non-binding indicative votes on Monday, but there is little confidence in the market that any new resolution is at hand. The April 12th time fame is now in effect for the UK to find an acceptable path forward to unlock the extension to May 22nd. EC President Donald Tusk called a European Council for April 10th to ready Europe an increasingly threatening course forward. If you intend to trade the Pound, beware the high probability of volatility with uncertainty cutting liquidity and leveraging the impact of headlines. If we find any consistency, I like GBPUSD's range as a bullish candidate with a Pound rally - path of least resistance. If the Sterling is to enter a concerted drop, I like the head-and-shoulders patterns from GBPJPY and GBPAUD.
Chart of GBPAUD (Daily)
So long as we move forward with the UK-EU divorce with no resolution in sight, the concern surrounding the economic and financial fallout will radiate further and further outward. The most immediate blowback outside of the UK's borders is the direct implications an economic and liquidity break would mean for the European Union / Eurozone. We are already starting to register some of the weight of this trade partner issue with an equally-weighted Euro index dropping support dating back to 2017 this past week when local issues have failed to do so. That said, there are additional local issues that could amplify the currency's trouble. The ECB's position will come into view with their preferred data (CPI and jobless rate) on tap along with the central bank's minutes. Italy is another Euro issue that can be revived. If Europe is generally depressed by a painful divorce (along with their own individual, local issues), there is only one direction for capital to flow: towards greater liquidity. The only FX source with greater depth that the Euro and Pound is the US Dollar. That chief alternative view role is similar to its utility as an 'ultimate haven'. Liquidity first, second and last.
The Important Risk Signal from Global Yields, Crude Oil Prices and Gold
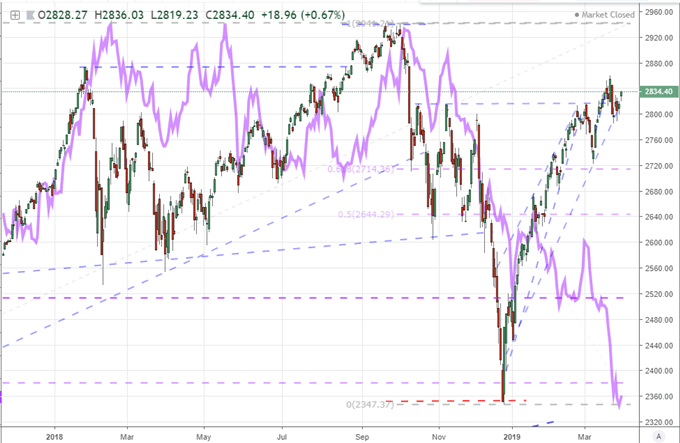
As we keep tabs on blatant systemic risks and regional fundamental troubles, it is important that we look to a variety of market measures to garner a more complete picture of what we are dealing with. The US indices for example may be the best performing risk assets, but that also comes with a poor track record for giving early signal of tentative tide changes towards global risk aversion. In particular, I am focusing on the implications of global government bond yields in their capacity as a reflection of investor expectations - just like the Dow - but also their more reliable connection to growth. It could be said that yields are being artificially driven lower by central banks' penchant for extreme accommodation, which would be fair. That said, these authorities are theoretically applying policy against their expectations for economic and financial health which would thereby be troubled. The severe disparity between the S&P 500 and aggregate 10-year government bond yield index (US, UK, German and Japanese issues) troubles me the most. These two measures will converge, and it is not likely yields that will be closing the gap.
Chart of the S&P 500 and Aggregate Yields of US, UK, GE, JP 10-Year Gov’t Bonds (Daily)
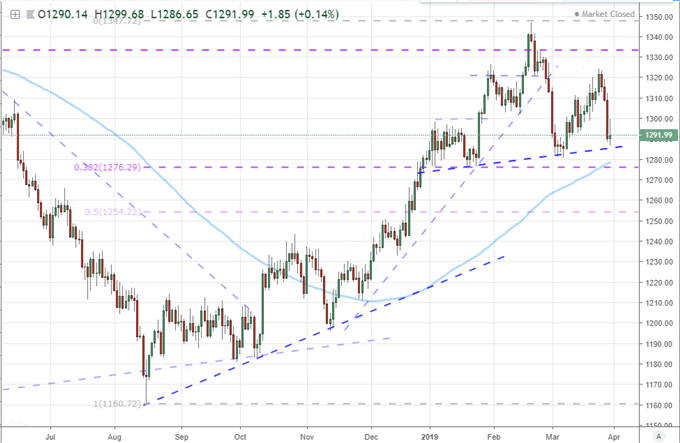
Meanwhile, commodities are offering important signals of their own. Crude oil is another asset that finds deeper rooting in economic health, which is often a throttle on sheer speculative appetite which a measure like the US indices enjoy. The rebound from crude oil prices so far this year is a far smaller percentage than its local equity counterpart. Nevertheless, its first quarter was still the strongest in 10-year - and following the worst quarterly performance since the Great Financial Crisis. More recent price action shows a very unconvincing effort to break weeks of range and close above $60 in only the most technical of capacities. This doesn't register well for the connection of economic fortitude and investor appetite. As for gold, the risk implications are far less significant. The metal is a safe haven of a particular sort: seeking an alternative to traditional 'fiat' assets that are degraded by extreme central bank actions, burgeoning deficits and an unwillingness of governments to pick up the flagging system. As much as that mix seems to have progressed these past weeks, gold has actually dropped this past month and week. Friday's tumble was hefty and we find the market is staging a very clean head-and-shoulders pattern. The chart says one thing, but the financial system and this commodity's role suggest a very different next stage. We discuss all of this and more in this weekend Trading Video.
Chart of Gold and 100-day Moving Average (Daily)
If you want to download my Manic-Crisis calendar, you can find the updated file here.


