


Highlights:
- DXY bounces from overnight low, likely on month-end profit taking
- Fed digested as dovish for future hikes as per steepening UST 5s30s
- EUR/USD and USD/CAD tag 2.618% Fibonacci extension off initial 2017 move, Testing 200-WMA
- Sentiment Highlight: Crude Oil net-short positions rise ~40% week over week
The dollar seemed to have found life after trading at fresh 14-month lows after the Federal Reserve did what many expected them to do and hold rates at 1% and promise a “relatively soon” unwinding of their balance sheet that ballooned to $4.5T in response to 2008. However, in further dismembering of the statement that was not followed by a press conference, it appears that their language on below target inflation is having the effect of less priced in rate hikes, which appears bad for the USD. The market is no longer pricing in a rate hike in 2017, and a weak print at Friday’s US Q2 GDP could bring that expectation even lower and take the USD with it. Given the typical counter-trend moves that happen at month-end, some traders are looking at the short-term weakness in equities and strength in USD as a position unwind of global trades that were long US equities that could re-emerge at the start of August.
Recommended DFX Event: US GDP Round Table Coverage
One market that traders are looking to see if there is hope for the USD bulls is the US Treasury market and the respective spread between different tenors. A focal spread has been the US5s30s. The bond market marker has widened lately as traders buy the front end (UST 5) bringing down the yield as less inflation is expected out of the US while the 30yr yield is moving higher (price lower). This widening is seen in anticipation that the Fed Balance sheet unwind will be their primary tool for policy tightening as opposed to rate hikes. If the spread continues to widen, it would be expected to align with further USD weakness as you can see in the chart below.
Are you looking for trading ideas? Our Q3 forecasts are fresh and ready to light your path. Click here to access for FREE.
July Trend Of Widening US5s30s Aligning With Weakening Dollar Index (Orange Line)
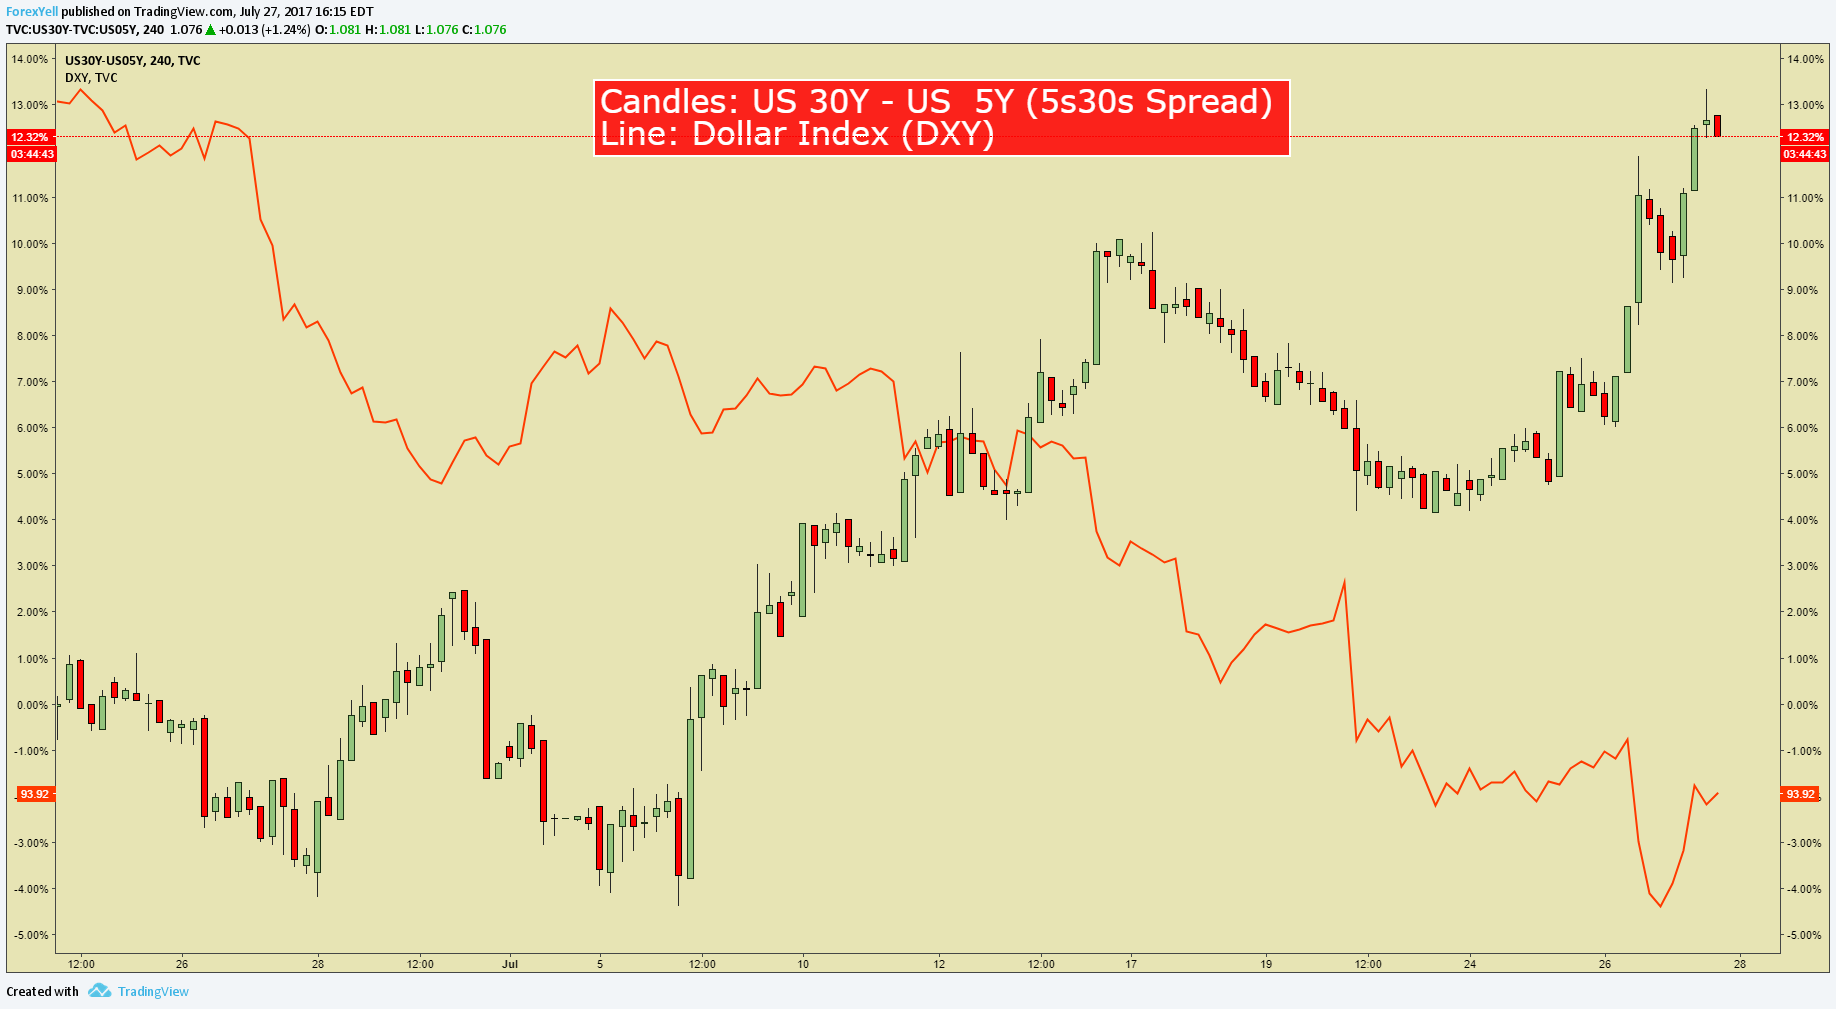
Chart created by Tyler Yell, CMT
For technically focused traders, many like to look at the 200-Day Moving Average as it covers nearly a rolling year’s average price. However, beyond the 200-Day is the 200-Week and a plethora of markets including EUR/USD, EUR/JPY, AUD/USD, EUR/CHF, USD/CHF, AUD/JPY, CAD/JPY, USD/CAD are seeing their price get awfully close or bouncing off the 200-DMA. While volatility has been low in equities, it could soon accelerate in FX if the price of any of these market has a strong reaction to the 200-WMA. Of particular focus is the price of EUR/USD & USD/CAD that have recently seen a 2.618% extension off their initial move of 2017. If the momentum remains, we could see a small pullback before the trend extends through the 200-WMA, which could align with a new era of cemented USD weakness. We’ll see.
JoinTylerin his Daily Closing Bell webinars at 3 pm ET to discusstradeable market developments.
FX Closing Bell Top Chart: EUR/USD tests the 2.618% extension + 200-WMA (1.1794)

Chart Created by Tyler Yell, CMT
Tomorrow's Main Event: USD Gross Domestic Product (Annualized) (2Q A)
Want to see the market’s reaction upon the news release? Need to ask questions to an analyst? Join the US GDP round table live broadcast.
IG Client Sentiment Highlight: US Oil net short positions rise ~45% Week over Week
The sentiment highlight section is designed to help you see how DailyFX utilizes the insights derived from IG Client Sentiment, and how client positioning can lead to trade ideas. If you have any questions on this indicator, you are welcome to reach out to the author of this article with questions at tyell@dailyfx.com.
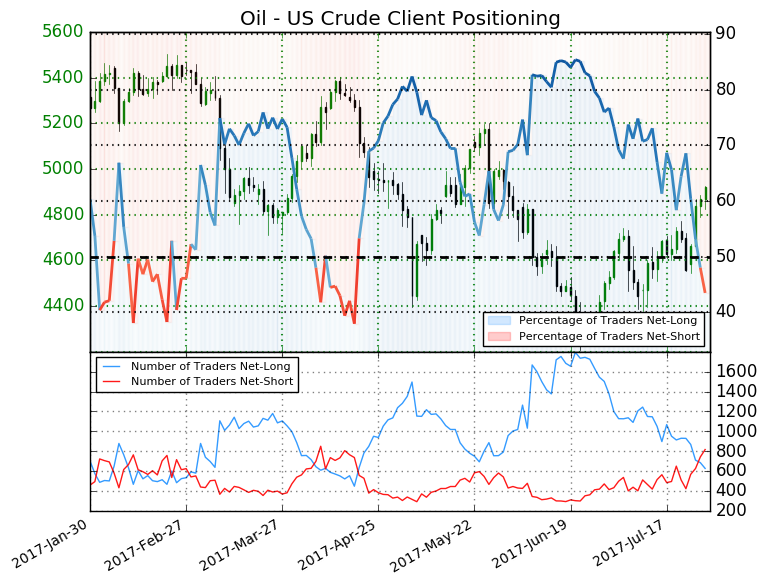
Oil - US Crude: Retail trader data shows 43.6% of traders are net-long with the ratio of traders short to long at 1.29 to 1. The number of traders net-long is 8.8% lower than yesterday and 26.3% lower from last week, while the number of traders net-short is 19.4% higher than yesterday and 45.8% higher from last week.
We typically take a contrarian view to crowd sentiment, and the fact traders are net-short suggests Oil - US Crude prices may continue to rise. Traders are further net-short than yesterday and last week, and the combination of current sentiment and recent changes gives us a stronger Oil - US Crude-bullish contrarian trading bias.(Emphasis mine)
---
Written by Tyler Yell, CMT, Currency Analyst & Trading Instructor for DailyFX.com
To receive Tyler's analysis directly via email, please SIGN UP HERE
Contact and discuss markets with Tyler on Twitter: @ForexYell


