


Gold, XAU/USD, Bull Flag, Double Bottom, IGCS – Talking Points:
- Gold’s recent slide lower looks to be a temporary set-back.
- A weekly Bull Flag continuation pattern, and daily Double Bottom reversal hint at further gains for the anti-fiat asset.

Gold prices have stormed higher in April, climbing over 7% to push to the highest levels since late-February. Although the commodity has slipped lower in recent days the long-term outlook continues to hint at extended gains ahead. Here are the key levels to watch for the anti-fiat metal in coming weeks.
Gold Weekly Chart – 55-EMA Guiding Price Higher
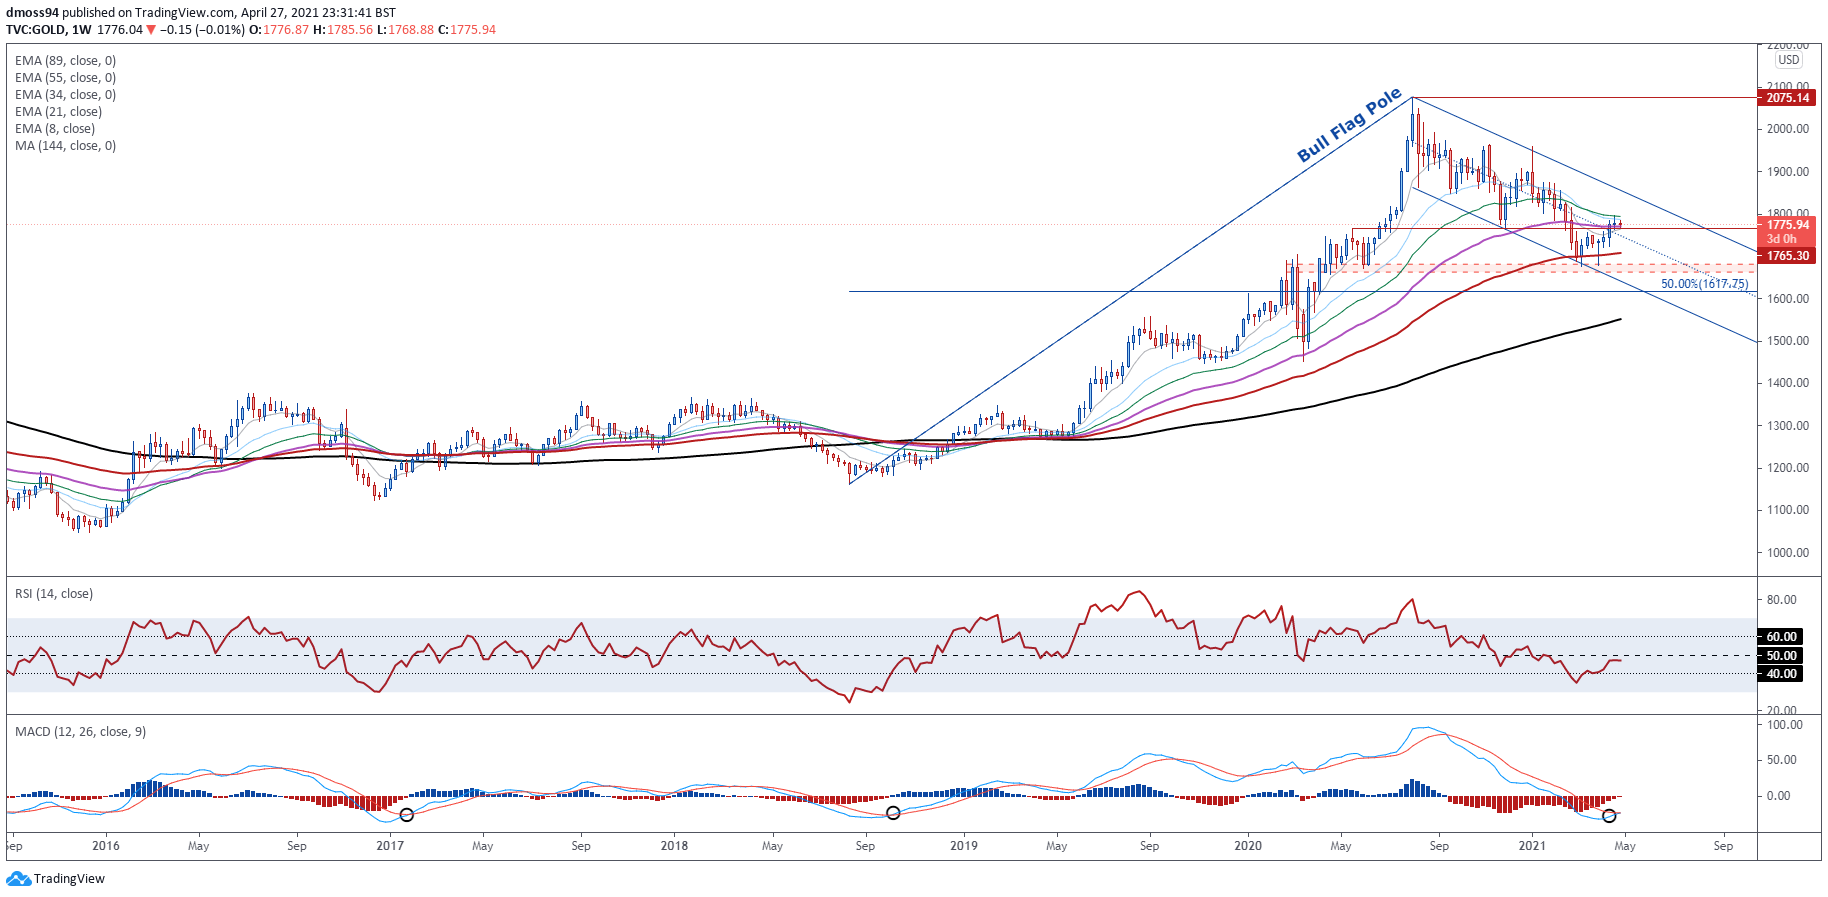
Chart prepared by Daniel Moss, created with Tradingview
The weekly chart highlights the significant corrective phase that gold has been in since peaking in August of last year, with price grinding just over 19% lower to test the 89-EMA (1708) for the first time since May of 2019.
This downhill slog however, still doesn’t seem to be a change in the overall bullish trend seen over the last three years, as prices carve out a possible Bull Flag continuation pattern.
With anti-fiat bullion slicing back above the trend-defining 55-EMA (1771), and a bullish crossover taking place on the MACD indicator, the path of least resistance does indeed seem skewed to the topside.
Holding constructively above 1760 probably opens the door for buyers to continue driving the commodity higher in the weeks ahead. That being said, if support gives way a swift decline back to the yearly low (1677)
Gold Daily Chart – Double Bottom Playing Out

Chart prepared by Daniel Moss, created with Tradingview
Zooming into the daily chart reinforces the bullish outlook depicted on the weekly timeframe, as prices validates the topside break of a Double Bottom reversal pattern.
If neckline support at 1755 – 1765 hold firms, a move to fulfil the pattern’s implied measured move (1832) seems likely in the near term.
However, if sellers can drive gold back below support, a pullback to psychologically imposing 1700 mark could be on the cards.
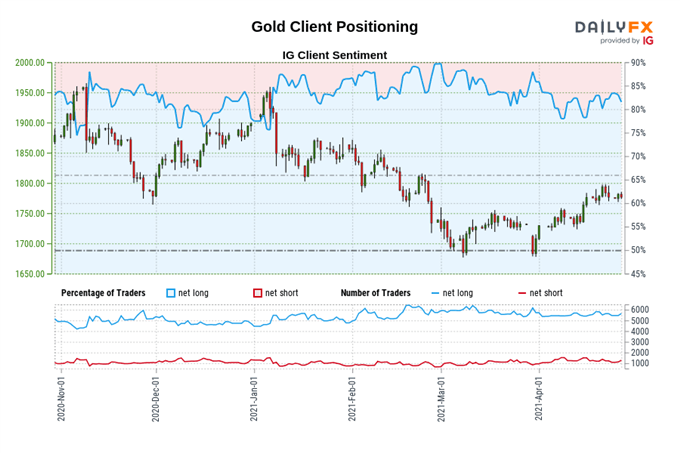
The IG Client Sentiment Report shows 82.58% of traders are net-long with the ratio of traders long to short at 4.74 to 1. The number of traders net-long is 2.55% higher than yesterday and 1.03% lower from last week, while the number of traders net-short is 4.46% lower than yesterday and 2.01% lower from last week.
We typically take a contrarian view to crowd sentiment, and the fact traders are net-long suggests Gold prices may continue to fall.
Traders are further net-long than yesterday and last week, and the combination of current sentiment and recent changes gives us a stronger Gold-bearish contrarian trading bias.
-- Written by Daniel Moss, Analyst for DailyFX
Follow me on Twitter @DanielGMoss


