


Gold Technical Price Outlook: XAU/USD Near-term Trade Levels
- Gold price updated technical trade levels – Daily & Intraday Charts
- XAU/USD recovery makes first resistance test – looking for inflection off 1884/88
- New to Gold Trading? Get started with this Free How to Trade Gold -Beginners Guide
Gold prices have rallied more than 1.8% since the start of the week with XAU/USD building on last week’s reversal off technical support. The advance is now facing its first test of downtrend resistance and we’re looking for a reaction just higher for guidance. These are the updated targets and invalidation levels that matter on the XAU/USD technical charts heading into the close of a volatile week. Review my latest Strategy Webinar for an in-depth breakdown of this gold technical setup and more.
Gold Price Chart - XAU/USD Daily

Chart Prepared by Michael Boutros, Technical Strategist; Gold on Tradingview
Technical Outlook: In last month’s Gold Price Outlook we noted that a break of the November opening-range kept the focus lower in XAU/USD and to be on the, “lookout for a low heading into the close of the month with December typically a supportive month for Gold prices.” Bullion registered a low at the 38.2% retracement / channel support at 1764 before mounting a rally of more than 6.2% into the December open – is a low in place?
The recovery is facing its’ first test here at confluence trendline resistance with the 38.2% retracement of the August decline just higher at 1883 – a breach / close above this threshold is needed to suggest a more significant low is in place with such a scenario shifting the focus back towards 1920 and the 61.8% Fibonacci retracement at 1956.
Gold Price Chart - XAU/USD 240min
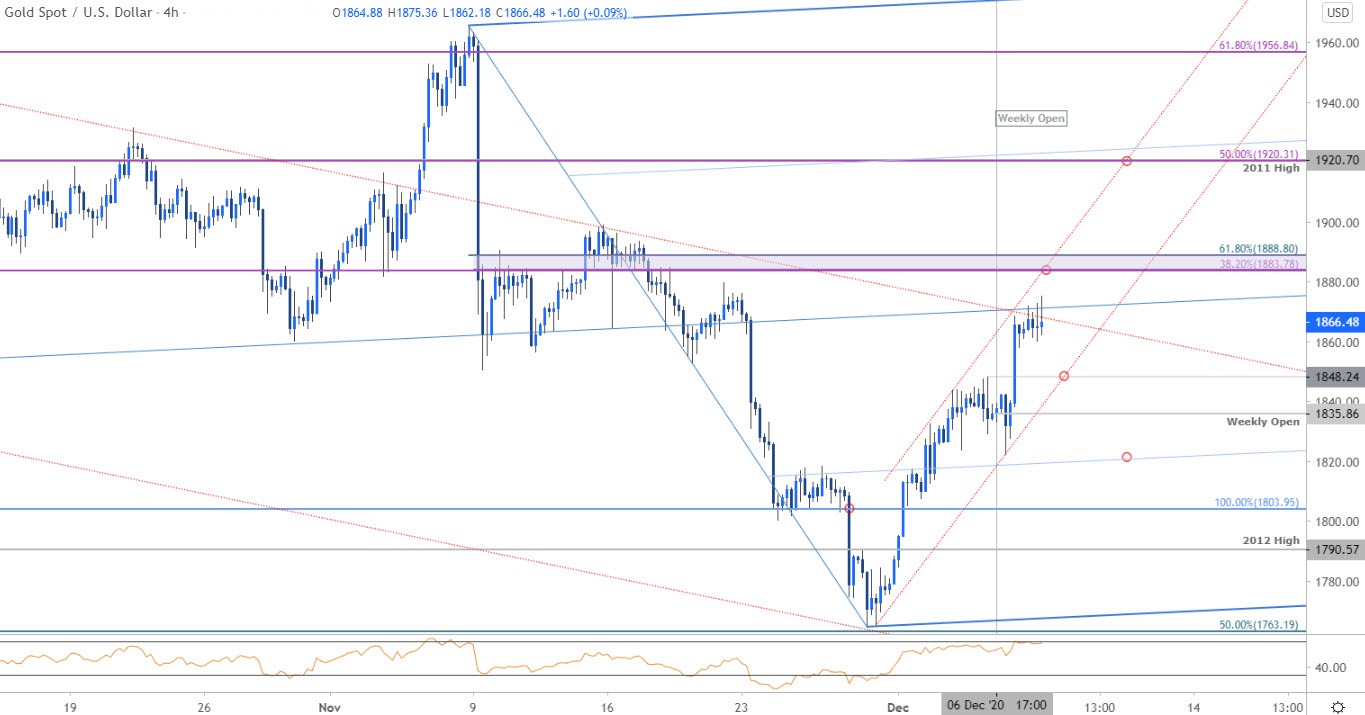
Notes: A closer look at Gold price action shows XAU/USD trading within the confines an ascending pitchfork formation extending off the September / November lows with an embedded channel guiding this most recent advance. Initial support now 1848 backed by the weekly open at 1835- ultimately a break below the weekly low near 1820 would be needed to threaten another run at the lows.

Bottom line: The gold price collapse responded to confluence support with the recovery now approaching downtrend resistance. From a trading standpoint, look to reduce long-exposure / raise protective stops on a stretch into confluence resistance near 1884/88 – look for a reaction / pivot there with a breach / close above needed to suggest a more significant low is in place. Ultimately weakness should be limited by 1820s IF price is heading higher on this stretch. Review my latest Gold Weekly Price Outlook for a closer look at the longer-term XAU/USD technical trading levels.
For a complete breakdown of Michael’s trading strategy, review his Foundations of Technical Analysis series on Building a Trading Strategy
Gold Trader Sentiment – XAU/USD Price Chart

- A summary of IG Client Sentiment shows traders are net-long Gold- the ratio stands at +3.47 (77.64% of traders are long) – typically bearishreading
- Long positions are0.16% lower than yesterday and 14.40% lower from last week
- Short positions are 2.56% higher than yesterday and 35.03% higher from last week
- We typically take a contrarian view to crowd sentiment, and the fact traders are net-long suggests Gold prices may continue to fall. Yet traders are less net-long than yesterday and compared with last week. Recent changes in sentiment warn that the current Gold price trend may soon reverse higher despite the fact traders remain net-long.
| Change in | Longs | Shorts | OI |
| Daily | -4% | 1% | -2% |
| Weekly | 9% | -15% | -4% |
---
Active Technical Setups
- Canadian Dollar Outlook: USD/CAD Plunges to 2020 Yearly Open Support
- Mexican Peso Outlook: USD/MXN Bears Tire Near Downtrend Support
- Australian Dollar Forecast: Aussie Rally at Risk into Resistance
- Sterling Forecast: Cable Caught by Uptrend Resistance- GBP/USD Levels
- Euro Outlook: EUR/USD Breakout Fails Resistance- Election Rally Over?
- Written by Michael Boutros, Technical Strategist with DailyFX
Follow Michael on Twitter @MBForex


