


XAU/USD Technical Outlook
- Gold benefited from a weaker risk-on sentiment
- XAU/USD price chart exposes signals of bull’s indecision
Gold Price- Recovered Losses
On June 5, Gold declined to its lowest level in over six weeks at $1,670 however, last week the market traded higher and closed the weekly candlestick in the green with a 2.6% gain.
The Gold price retreated amid hopes of a V-shape recovery in the US and the rest of the world caused by governments stimulus plans and a faster pace of economies reopening. Nonetheless, the market reversed direction on growing concerns that a resurgence of coronavirus cases could pause the pace of recovery or even lead to fresh restrictions.
Gold DAILY PRICE CHART (DEC 5, 2018 – June 15, 2020) Zoomed out


Gold DAILY PRICE CHART (March 5 – June 15, 2020) Zoomed In

On April 23, Gold corrected its upward trend and carved out a lower high at $1,739. Since then, the price has traded in a sideways move then developed a head and shoulders pattern.
Hence, any break below the neckline of this pattern located at $1,670 would be considered a bearish signal.
On May 18, the precious metal rallied to an over seven and a half -year high at $1,765 however, the market reversed lower to the current trading zone $1,685 - $1,752 reflecting bull’s hesitation at this stage.
A close below the low end of the aforementioned zone could send XAU/USD even lower towards $1,635. Any further close below that level may encourage bears to press towards $1,555.
On the flip-side, a close above the zone signals that bulls could push towards $1,796. A further close above that level may extend the rally towards $1,859.

Gold Four-HOUR PRICE CHART (May 1 – June 15, 2020)
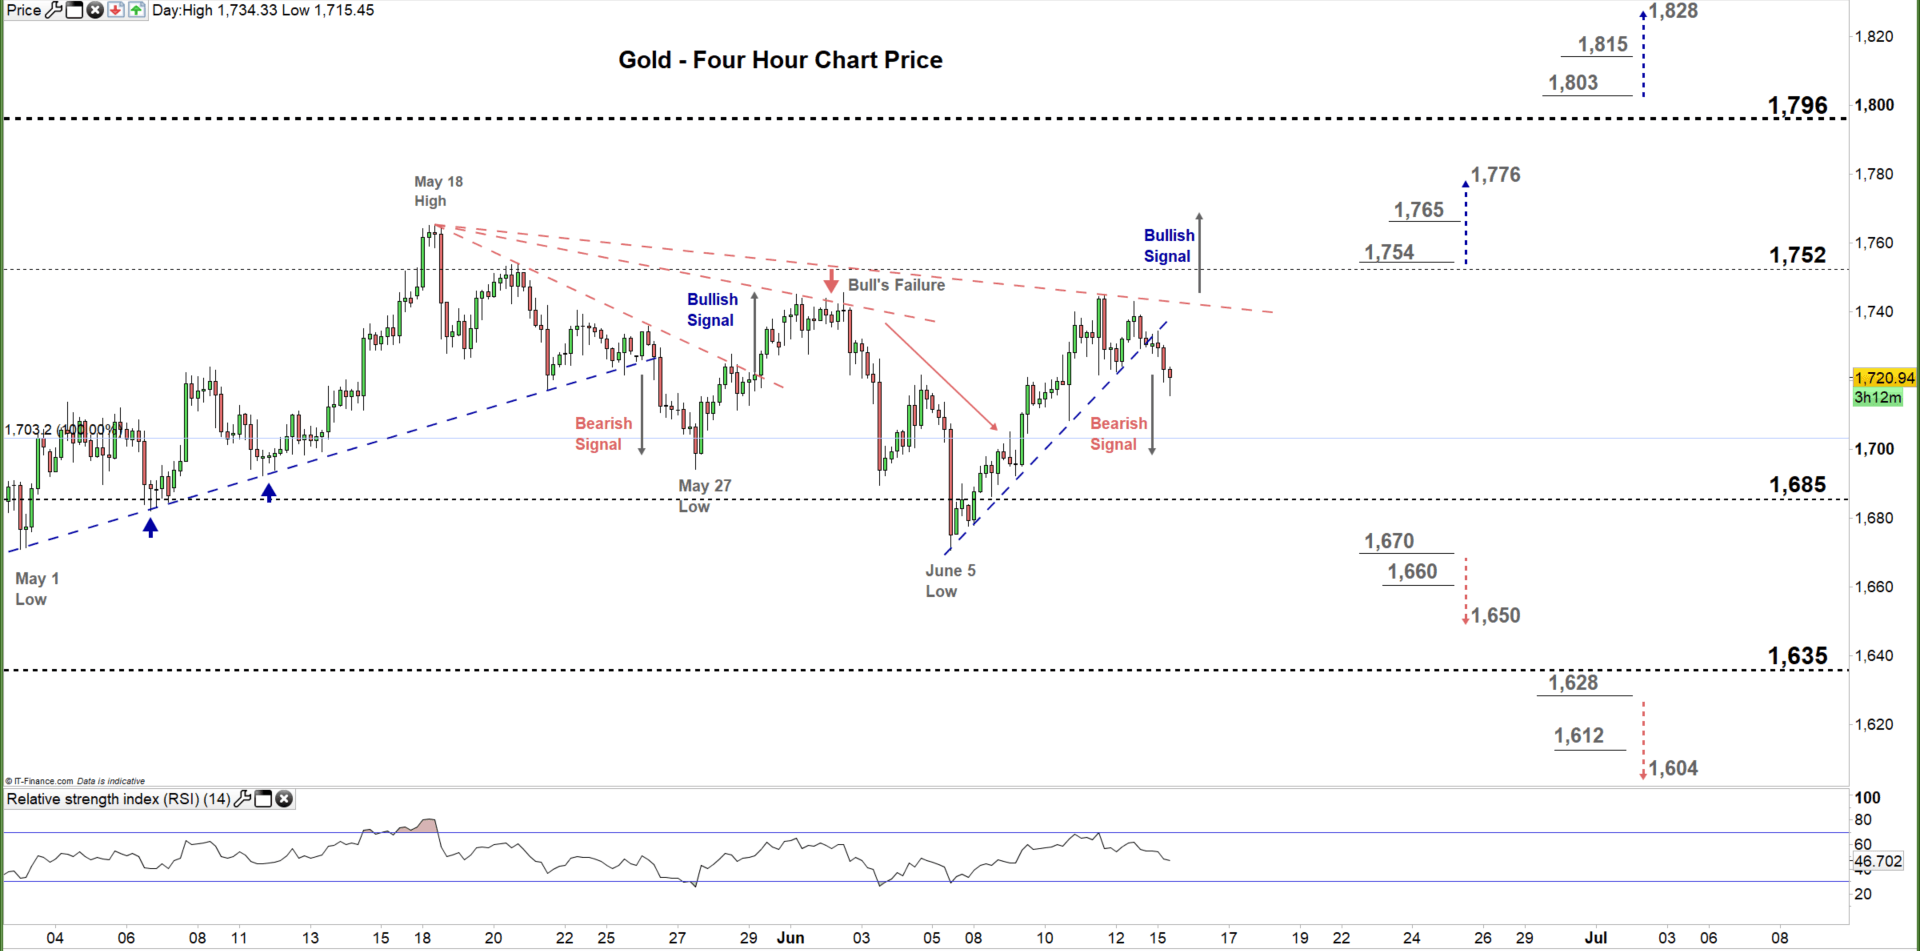
On May 29, XAU/USD rallied above the lower line on the downtrend lines fan originated from the May 18 high at $1,765 and generated a bullish signal. Yet, the price failed to overtake the middle line on the aforementioned fan signaling bull’s indecision.
On Friday, Gold broke below the uptrend line originated from the June 5 low at $1,670, and produced a bearish signal. That said, any break above the higher downtrend line on the fan could generate a bullish signal.
Thus, a break below the mentioned above June 5 low could send Gold towards $1,650 on the other hand, any break above $1,754 may trigger a rally towards $1,776. Nonetheless, the daily resistance and support levels marked on the four-hour chart should be watched closely.

Written By: Mahmoud Alkudsi, Market Analyst
Please feel free to contact me on Twitter: @Malkudsi


