


XAU/USD Price Technical Forecast
- Gold price rebounds from its lowest level since the start of May
- A selloff, or more consolidation?
Gold Price Edging Lower
On Friday, Gold declined to a five-week low at $1,670 then closed the weekly candlestick in the red with a 2.5% loss. This week, the market opened with a downside gap at $1,683 yet, the metal rallied after and closed this gap.
Alongside that, the Relative Strength Index (RSI) fell from 49 to 39 highlighting that bears were in charge.
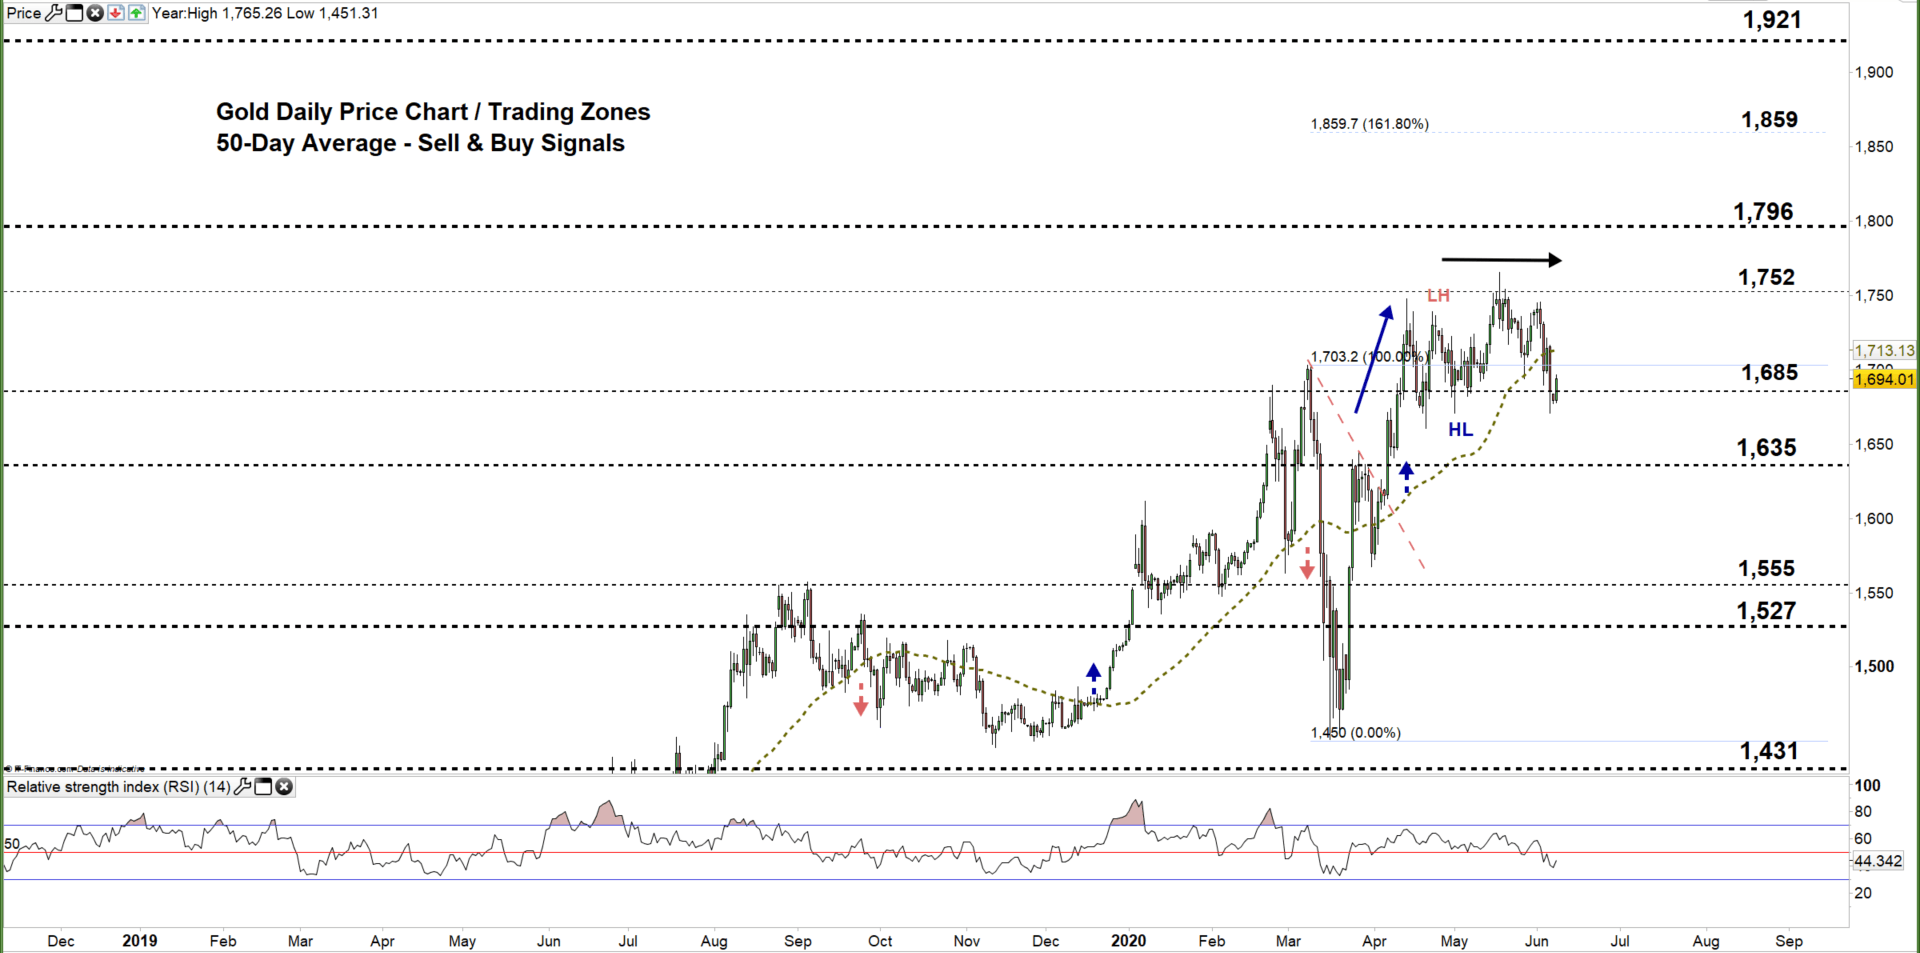
Gold DAILY PRICE CHART (DEC 5, 2018 – June 8, 2020) Zoomed out

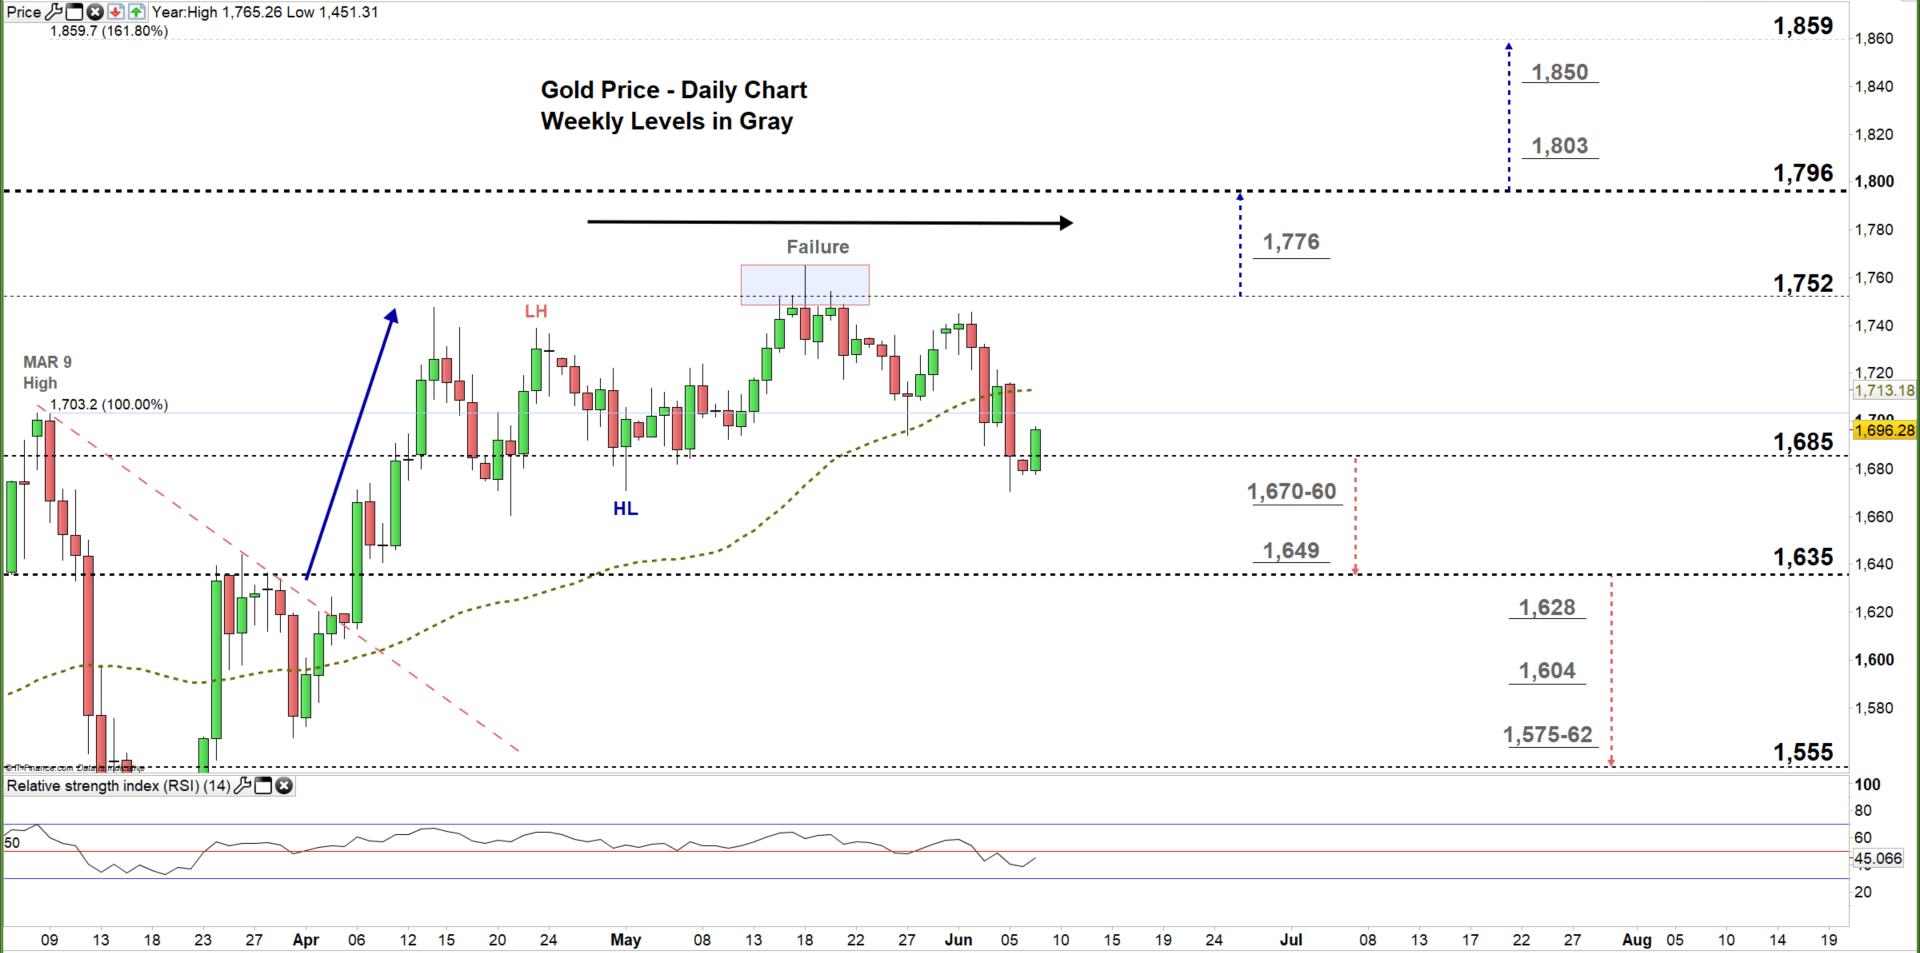
Gold DAILY PRICE CHART (March 5 – June 8, 2020) Zoomed In
On April 23, Gold corrected its upward trend and started a sideways move creating a set of lower highs with higher lows. In Mid-May, the price failed on multiple occasions to rally to the higher trading zone reflecting that bulls were losing momentum.
On Friday, the market tested the low end of the current trading zone $1,685 - $1,752 yet closed above it signaling a possible reversal towards the high end of the zone. Additionally, a further close above that level may extend the rally towards $1,796.
That said, any close below the low end of the zone could encourage bears to send XAU/USD towards $1,635. A further close below that level could send the precious metal even lower towards $1,555.
It's worth noting that, the weekly support and resistance levels underlined on the daily chart (zoomed in) should be monitored in both bullish/ bearish scenarios.

Gold Four-HOUR PRICE CHART (May 1 – June 8, 2020)

On May 26, XAU/USD broke below the uptrend line originated from the May 1 low at $1,670, and generated a bearish signal. A few days after, the price failed many times to rally above the aforementioned line reflecting bull’s lack of momentum.
Thus, a break below the May 1 low at $1,670 could send Gold towards $1,650 in turn, any break above $1,703 may trigger a rally towards $1,727. Nonetheless, the daily resistance and support levels marked on the four-hour chart should be kept in focus.

Written By: Mahmoud Alkudsi, Market Analyst
Please feel free to contact me on Twitter: @Malkudsi


