


Gold Price - XAU/USD Technical Outlook
- Gold price stabilized above $1,700/oz.
- Bullish signals on XAU/USD price chart
Reversed Higher
On Wednesday, Gold retreated and made an over two-week low at $1,694 however, the price rallied after and settled above the $1,700 handle. As a result, the weekly candlestick closed on Friday with a bullish Doji pattern signaling a possible bullish comeback.
Alongside that, the Relative Strength Index (RSI) remained flat above 50 highlighting a stalled bullish momentum.
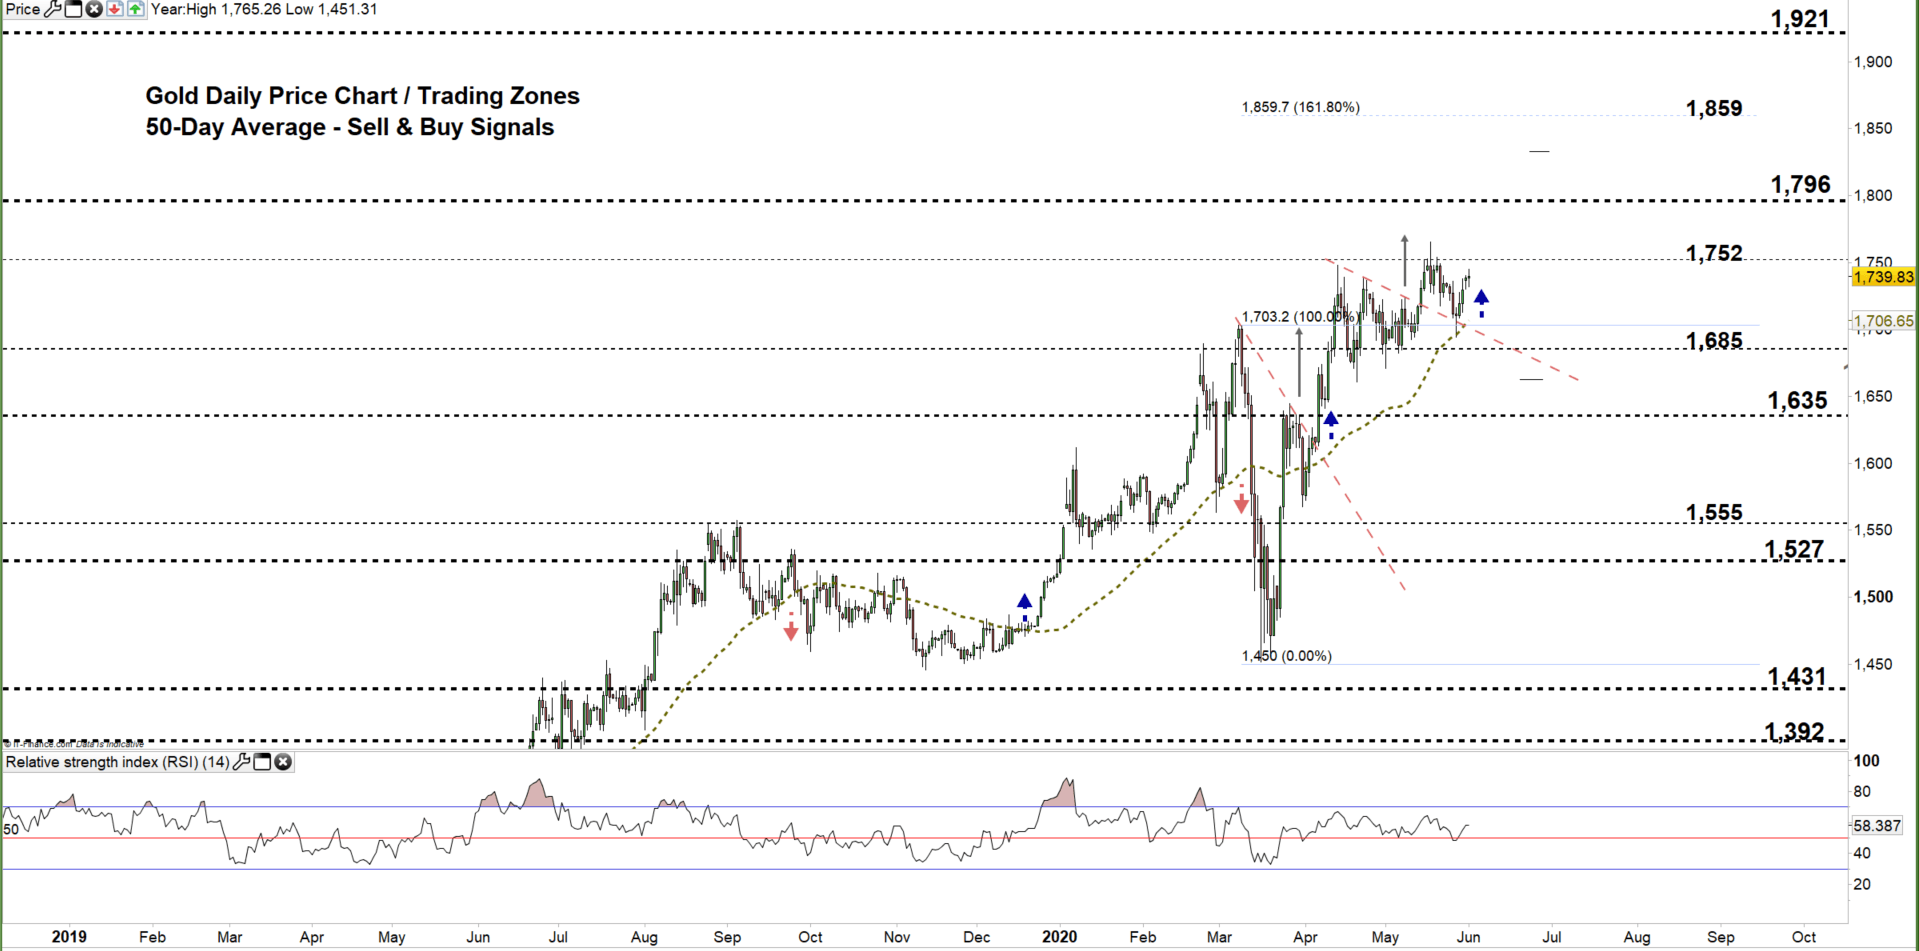
Gold DAILY PRICE CHART (DEC 5, 2018 – June 1, 2020) Zoomed out

Gold DAILY PRICE CHART (April 9 – June 1, 2020) Zoomed In
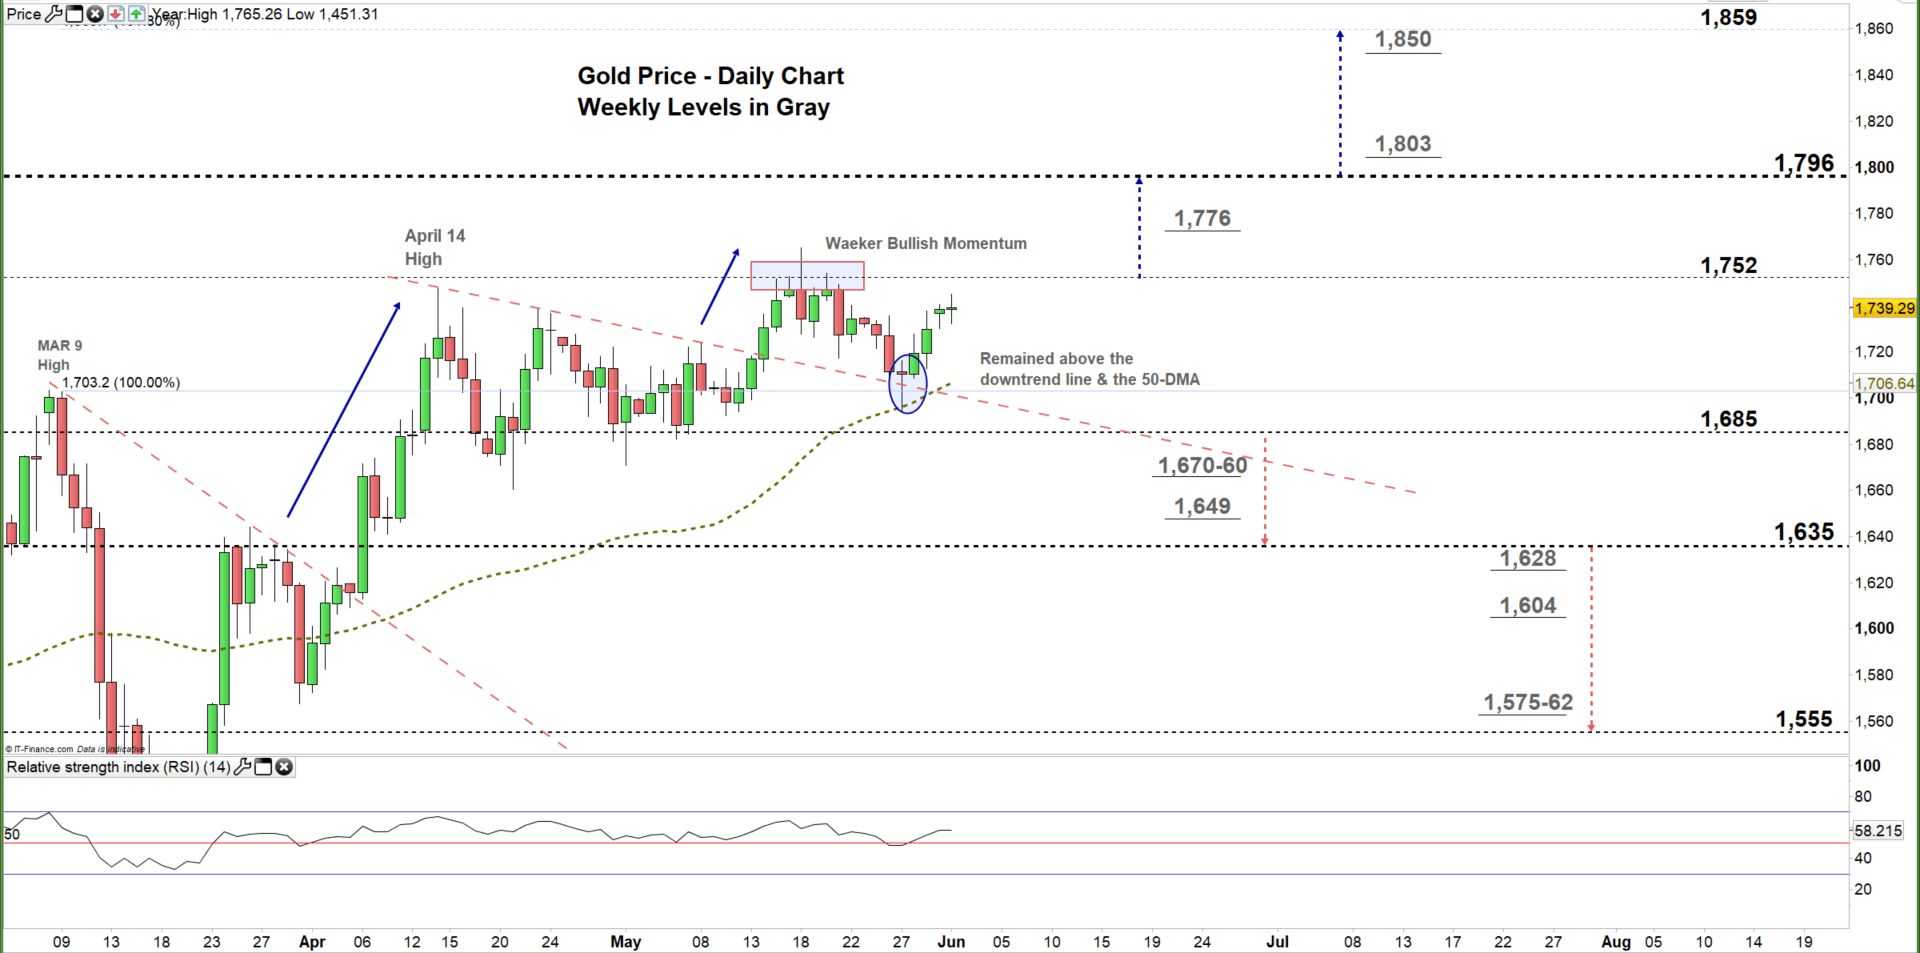
On May 14, Gold resumed bullish price action and broke above the downtrend line originated from the April 14 high at $1,747. On Wednesday, the price failed to break below the 50-day moving average, then closed above the aforementioned downtrend line indicating that bullish sentiment was still intact.
At present, the yellow metal eyes a test of the high end of the current trading zone $1,685- $1,752. Any successful close above this level signals that bulls may push towards $1,796. A further close above that level could extend this rally towards $1,859.
On the other hand, any failure in closing above the high end of the current trading zone reflects a weaker bullish bias and could reverse XAU/USD towards the low end of the zone. A further close below that level could send Gold even lower towards $1,635.
It’s worth noting that, the weekly support and resistance levels underlined on the daily chart (zoomed in) should be monitored in both bullish/ bearish scenarios.

Gold Four-HOUR PRICE CHART (April 20 – June 1, 2020)
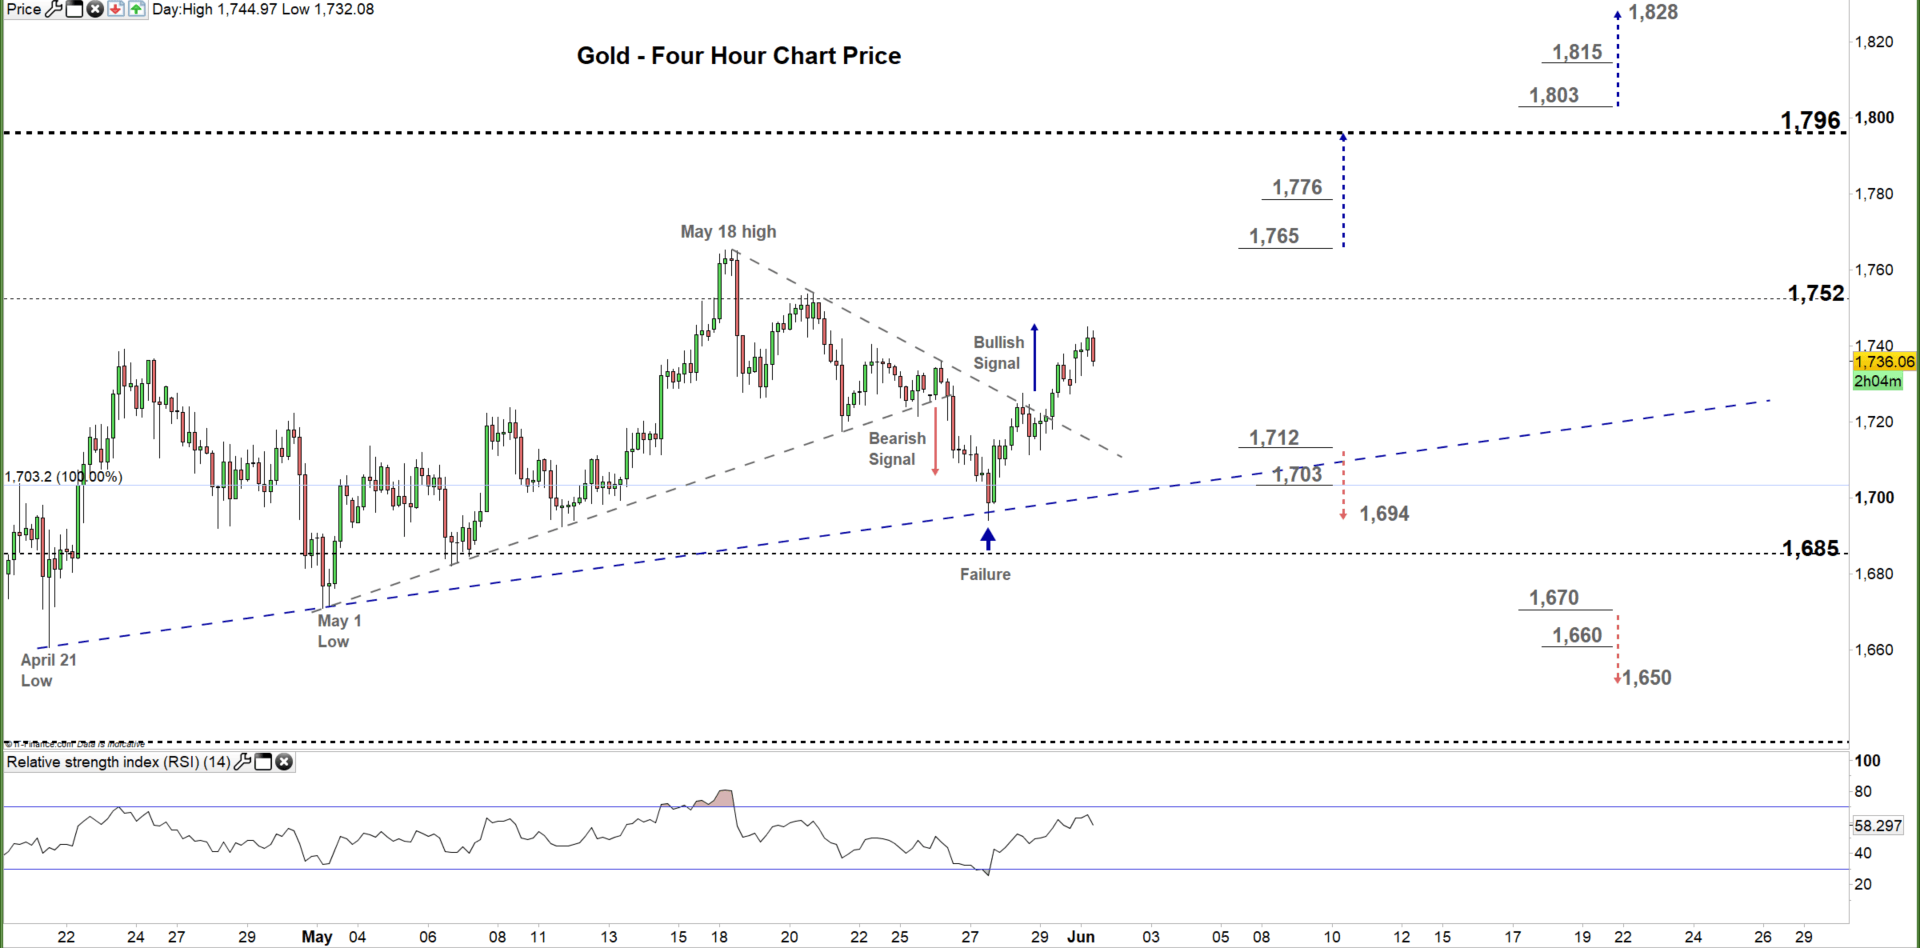
On May 26, XAU/USD rebounded then closed above the uptrend line originated from the April 21 low at $1,660 reflecting that bulls were still in charge. On Friday, the price violated the downtrend line originated from the May 18 high at $1,765 and generated a bullish signal.
Therefore, a break above the aforementioned above May 18 high could trigger a rally towards $1,796. In turn, any break in the other direction i.e. below $1,712 could send XAU/USD for a test of the last-week low at $1,694.
That said, the daily and weekly resistance/support marked on the four-hour chart should be kept in focus.

Written By: Mahmoud Alkudsi, Market Analyst
Please feel free to contact me on Twitter: @Malkudsi


