


Gold Price - XAU/USD Technical Analysis
- Fading bullish momentum
- Crucial levels and zones to keep an eye on
Corrected Lower
On Thursday, Gold created a lower high at $1,739 signaling a slowing down bullish momentum. Yet, on the following day the price closed the weekly candlestick in the green with a 2.6% gain.
This week, the Relative Strength Index (RSI) fell from 64 to 57 indicating that bulls were losing momentum.
Gold DAILY PRICE CHART (NOV 1, 2018 – April 29, 2020) Zoomed out


GOLD DAILY PRICE CHART (FEB 9 – APRIL 29, 2020) ZOOMED IN
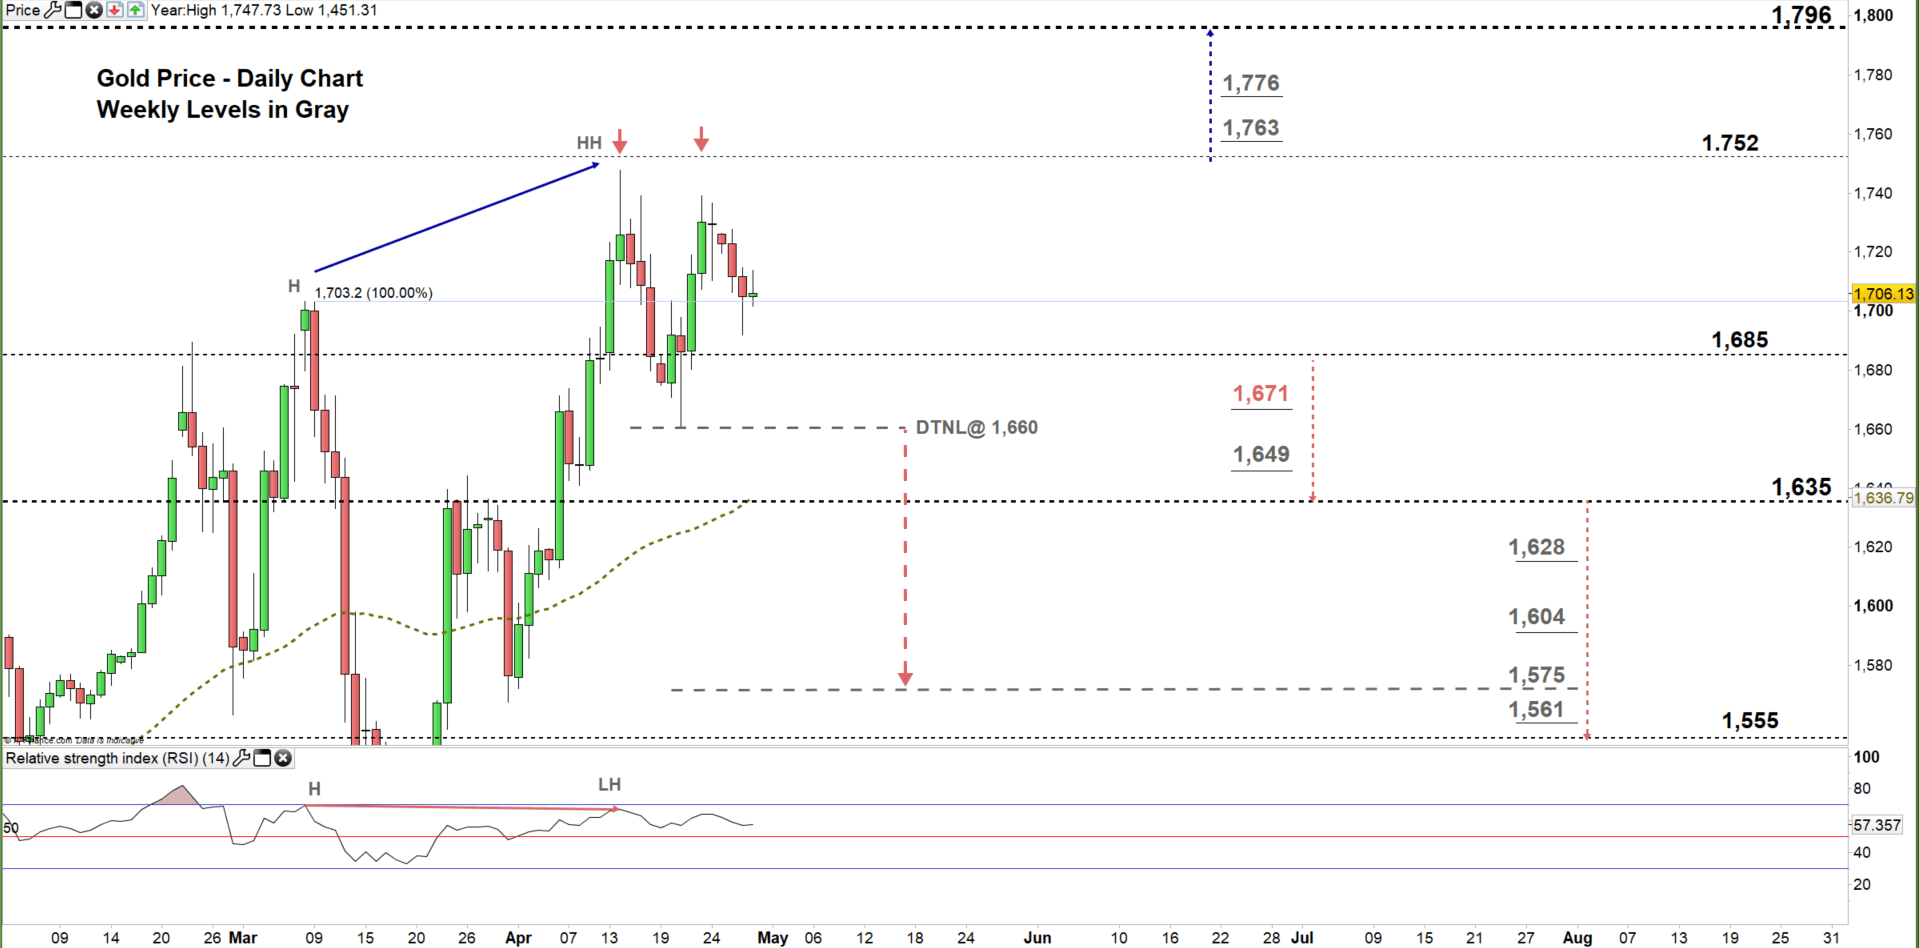
Looking at the daily chart, I noticed that on April 22 Gold climbed back to the current trading zone $1,685 - $1.752. However, this week the market U-turned and developed a double top pattern where the neckline is located at $1,660. A break below this level could send the yellow metal towards $1,575. Additionally, I spotted a bearish price/RSI divergence as the first created a high with a higher high meanwhile, the latter created a high with a lower high highlighting a possible reversal to the downside.
A close below the low end of the aforementioned trading zone reflects weaker bullish sentiment. This could send XAU/USD towards $1,635. A further close below that level could send the price even lower towards $1,555. In that scenario, the daily and weekly support levels underlined on the chart (zoomed in) should be considered.
On the flip-side, any failure in closing below the low end of the zone may cause a rally towards the high end. A further close above that level could extend this rally towards $1,796. That said, the weekly resistance levels marked on the chart should be kept in focus.

Gold Four-HOUR PRICE CHART (April 1 – April 29, 2020)
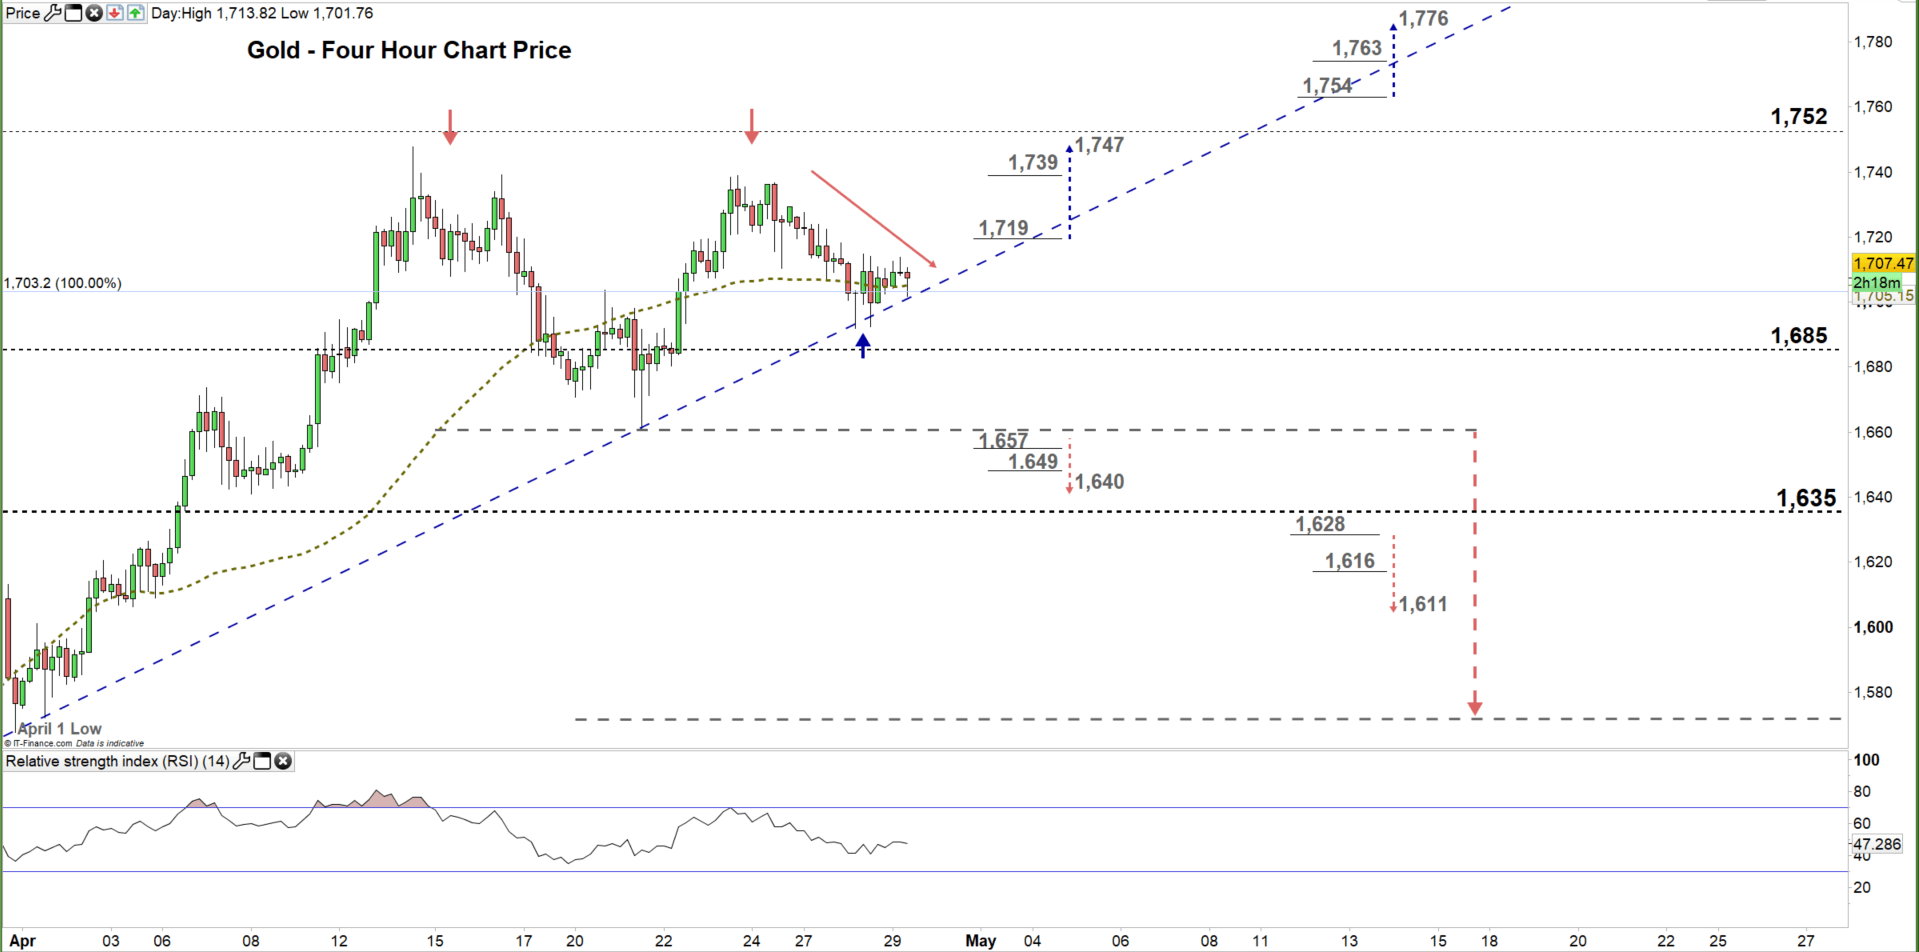
From the four-hour chart, I noticed that yesterday the price failed twice to overtake the uptrend line originated the April 1 at $1,567. Any violation of this line today would be considered a bearish signal.
A break below $1,657 would generate another bearish signal. This could send XAU/USD towards $1,640. Yet, the support level at $1,649 should be monitored. In turn, any break in the other direction i.e. above $1,719 may cause a rally towards $1,747. Nevertheless, the daily resistance level underscored on the chart should be watched closely.
See the chart to find out more about the key technical levels in a further bullish/bearish scenario.

Written By: Mahmoud Alkudsi, Market Analyst
Please feel free to contact me on Twitter: @Malkudsi


