


Gold Price - XAU/USD Technical Analysis
- Bulls are still in charge
- Will Gold price rally further or reverse lower?
Bullish Momentum is Still intact
On April 14, Gold soared to its highest level in nearly seven and half years at $1,747 then retreated after as some bulls seemed to cut back. On Friday, the weekly candlestick closed with a Doji candlestick highlighting the market’s indecision at this point.
This week, the Relative Strength Index (RSI) has crept from 55 to 64 signaling that bulls were back.
Gold DAILY PRICE CHART (DEC 9, 2018 – April 23, 2020) Zoomed out
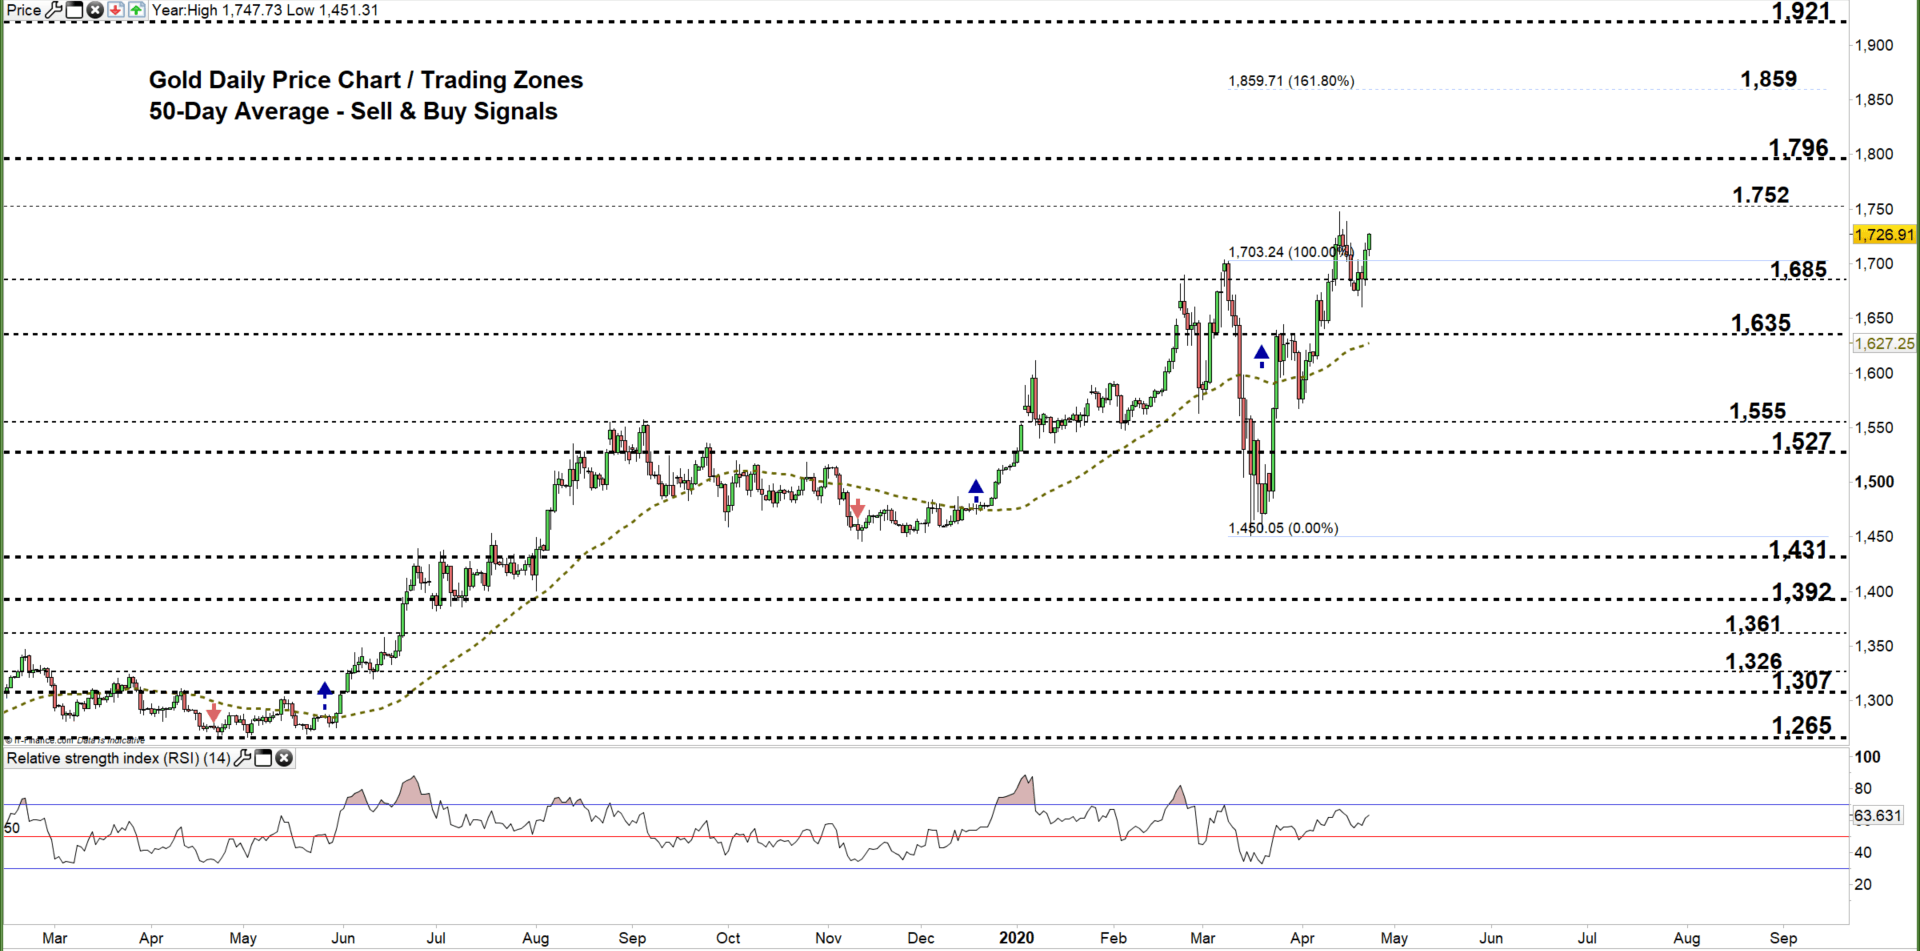

Gold DAILY PRICE CHART (JAN 25 – April 23, 2020) Zoomed In

Looking at the daily chart, I noticed that on Tuesday the price climbed back to the current trading zone $1,685 – $1,752 indicating that bulls did not give up control. Yesterday, the market rallied eyeing a test of the high end of the zone.
A close above the high end may extend this rally towards $1,796. Further close above that level could push XAU/USD even higher towards $1,859. Nevertheless, the monthly resistance levels underlined on the chart (zoomed in) should be considered.
On the other hand, any failure in closing above the high end of the zone could reverse the market’s direction towards the low end of the zone. Further close below that level might send Gold even lower towards $1,635. It is noteworthy that, the price in this scenario would develop a double top pattern. Any violation to the neckline located at $1,660 may send XAU/USD to the vicinity of $1,576-67. That said,, the daily and weekly support levels marked on the chart should be watched closely.

Gold Four-HOUR PRICE CHART (April 2 – April 23, 2020)

From the four-hour chart, I noticed that today Gold broke above the downtrend line originated from the April 14 high at $1,747 generating a bullish signal.
A break above $1,736 would be considered another bullish signal. This could cause a rally towards the high end of the current trading zone discussed above on the daily chart. Although, the resistance level residing at the April 14 high should be kept in focus. In turn, any break in the other direction i.e. below $1,703 may send XAU/USD towards the low end of the current trading zone. Yet, the daily support level underscored on the chart should be monitored.
See the chart to find out more about key technical levels in a further bullish/bearish scenario.

Written By: Mahmoud Alkudsi
Please feel free to contact me on Twitter: @Malkudsi


