


Gold Price - XAU/USD Technical Outlook
- Bullish comeback, yet with reluctance
- Will Bulls rally XAU/USD further?
Recovered Losses
Last week, Gold weakened slightly and declined to $1,567 . However, the price rallied after, then closed on Friday the weekly candlestick with a bullish Doji pattern.
This week, the Relative Strength Index (RSI) rose from 55 to 61 then remained flat after, highlighting interrupted uptrend move.
Gold DAILY PRICE CHART (MAR 25, 2019 – April 9, 2020) Zoomed out
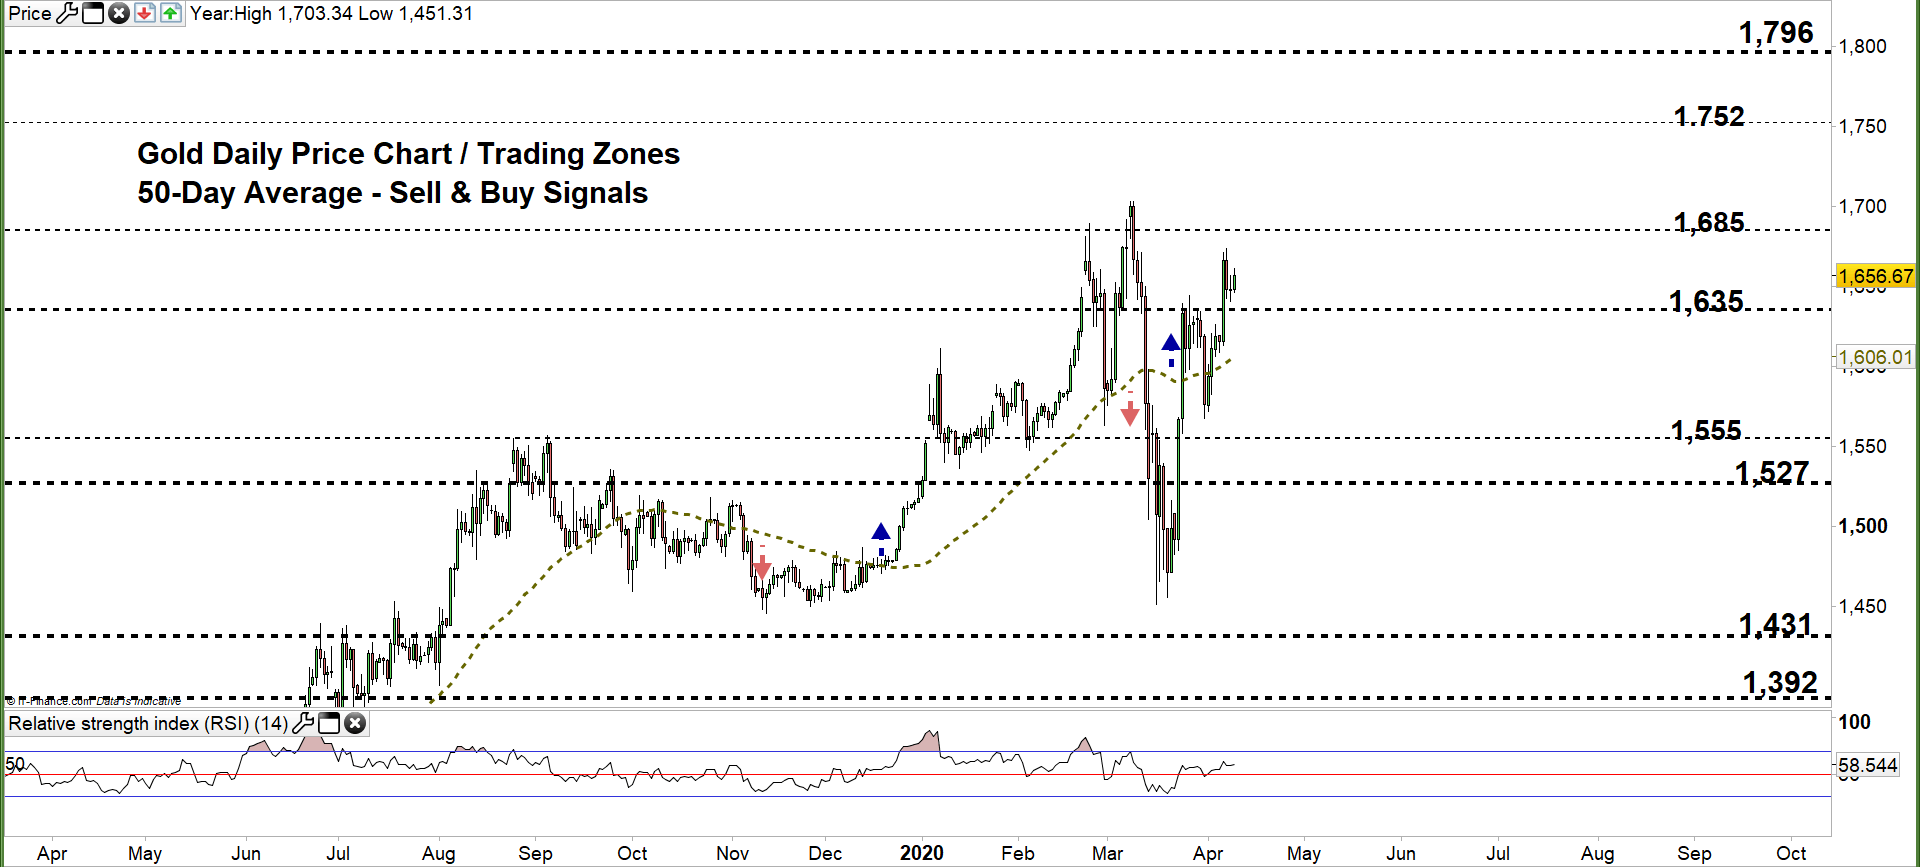

Gold DAILY PRICE CHART (JAN 25 – April 9, 2020) Zoomed In

Looking at the daily chart, we noticed that last week Gold U-turned then closed above the 50-day average providing a bullish signal. On Monday, The market climbed to current trading zone $1,635-$1,685 generating another bullish signal.
A close above the high end of the zone might encourage bulls to push towards $1,752. Further close above that level could mean more bullishness towards $1,796. Having said that, the monthly resistance levels underscored on the chart (Zoomed in) should be kept in focus.
On the flip-side, any failure in closing above the high end of the zone reflects bulls hesitation to rally Gold further. This may lead some of them to exit the market allowing the price to reverse towards the low end of the zone. Further close below that level could send XAU/USD even lower towards $1,555. In that scenario, the daily and weekly support levels marked on the chart should be monitored.

Gold Four-HOUR PRICE CHART (Mar 23 – April 9, 2020)
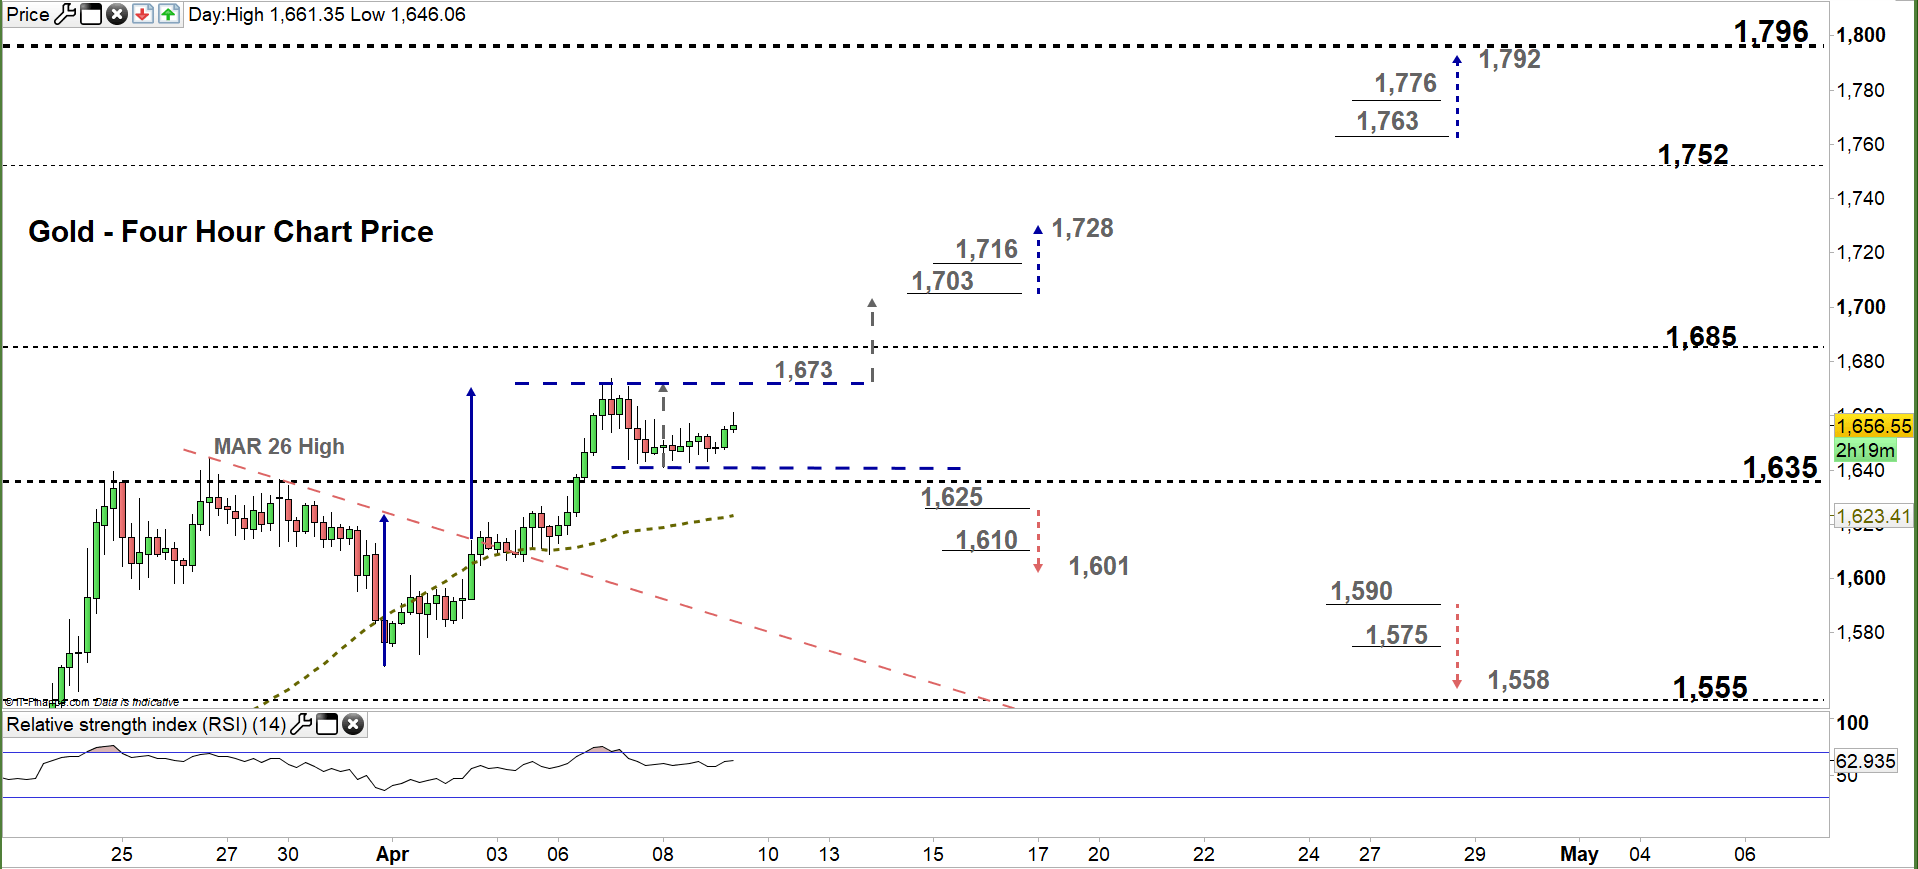
From the four-hour chart, we noticed that on Thursday the market broke above the March 26 high at $1,644 then rallied after. This week, the price has rebounded around $1.670 and currently Gold could be developing a bullish rectangle.
A break above its upper line could rally the price towards $1.703. Further break above this level might push XAU/USD towards 17.28. That said, the high end of current trading zone with the monthly resistance level underlined on the chart should be considered.
In turn, any break in the other direction i.e. below $1,625 increases the likelihood of XAU/USD falls towards $1,601. Although, the daily support level printed on the chart should be watched closely.
See the chart to find out more about key technical levels in a further bullish / bearish scenario.

Written By: Mahmoud Alkudsi
Please feel free to contact me on Twitter: @Malkudsi


