


Gold Price - XAU/USD Technical Forecast
- Bulls eye controlling the price action
- Signals and trading zones to keep in Focus
Edges Higher
Last week, Gold recovered majority of its losses and pushed to its highest levels in two weeks at $1,644. The price declined after, yet closed the candlestick closed on Friday in the green with 8.6% gain.
This week, the Relative Strength Index (RSI) remained flat above 50, reflecting paused uptrend move.
Gold DAILY PRICE CHART (Jan 15 – April 3, 2020) Zoomed out


Gold DAILY PRICE CHART (Dec 30 – April 3, 2020) Zoomed In
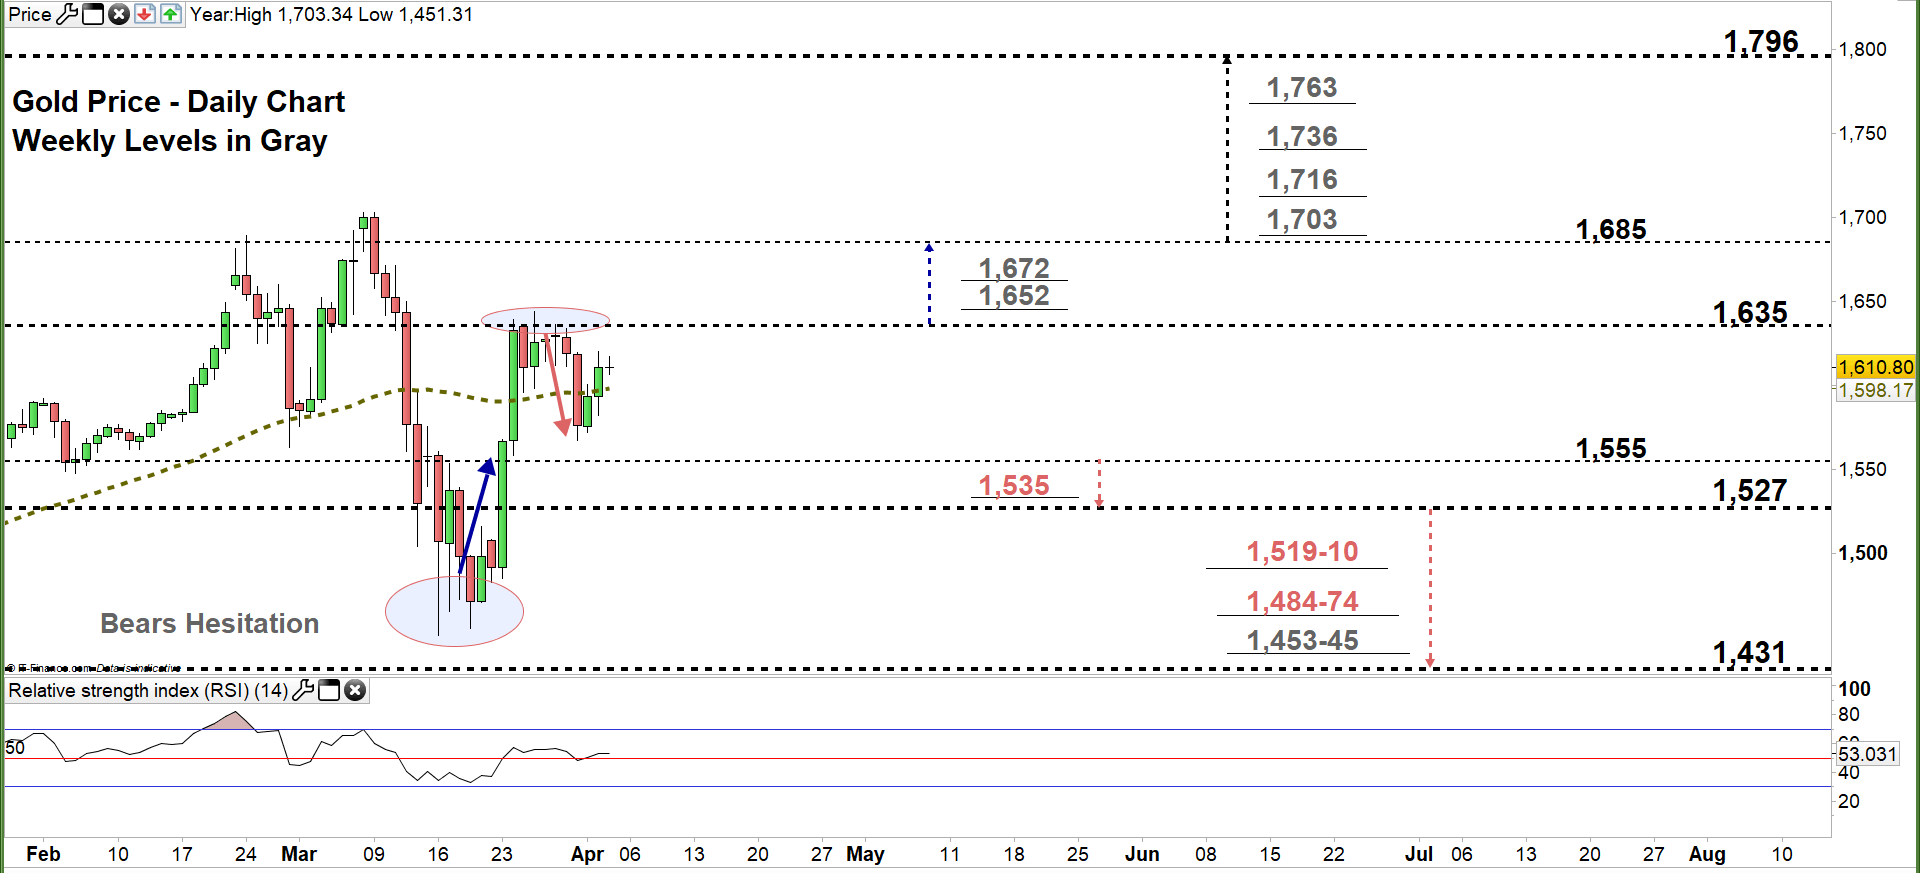
Looking at the daily chart, we notice that on March 16 Gold printed its lowest level in over three and half months at $1,451. Later on, bears showed reluctance, this allowed the market to rally and to settle above $1,500 handle. Last week, XAU/USD climbed and remained in current trading zone $1,555- $1,635 as failed in multiple occasions to move to the higher zone.
Yesterday, Gold closed above the 50-day average providing a bullish signal. Thus, a close above the high end of the zone may encourage bulls to push the price towards $1,685. Further close above that level could mean more bullishness towards $1,796. In this scenario, the weekly resistance levels underscored on the chart (zoomed in) should be watched closely.
In turn, any close below the low end of the zone could press XAU/USD towards $1,527. Further close below that level could send the price even lower towards $1,431. That said, the daily and weekly support level and areas marked on the chart should be considered.

Gold Four-HOUR PRICE CHART (Mar 10 – April 3, 2020)

From the four-hour chart, we noticed that on March 23 Gold rallied above the neckline of double bottom pattern located at $1,554. On March 26, the precious metal rebounded from $1,644 then started a sideways move creating lower highs with higher lows.
A break below $1,592 could send XAU/USD towards $1,558. Although, the daily support level underlined on the chart should be kept in focus. On the flip-side, a break above $1,652 may resume bullish price action towards $1,672. Although, the resistance level at $1,666 should be monitored.
See the chart to find out more about key technical levels in a further bullish / bearish scenario.

Written By: Mahmoud Alkudsi
Please feel free to contact me on Twitter: @Malkudsi


