


Gold Technical Price Outlook: XAU/USD Near-term Trade Levels
- Gold price updated technical trade levels – Daily & Intraday Charts
- XAU/USD breakdown stalls at long-term support pivot- focus on near-term consolidation
- New to Gold Trading? Get started with this Free How to Trade Gold -Beginners Guide
Gold prices are weaker this week but are well off the lows with XAU/USD trading at 1495 ahead of the New York close on Friday. Price responded to a long-term support pivot with a near-term consolidation range in focus within this week’s opening-range. While the broader risk remains weighted to the downside, the decline has taken gold into downtrend support and leaves the immediate short-bias vulnerable at these levels. These are the updated targets and invalidation levels that matter on the XAU/USD technical charts. Review my latest Weekly Strategy Webinar for an in-depth breakdown of this gold trade setup and more.
Gold Price Chart - XAU/USD Daily
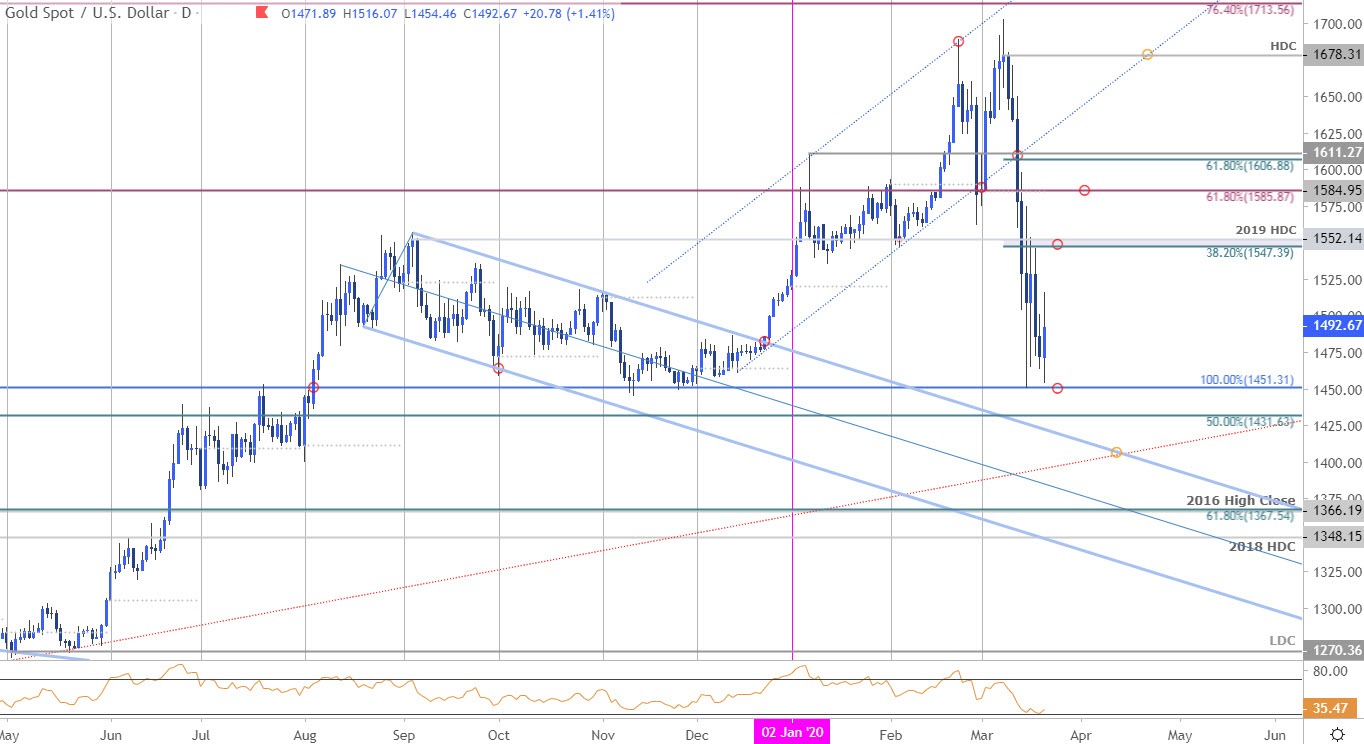
Chart Prepared by Michael Boutros, Technical Strategist; Gold on Tradingview
Technical Outlook: In my last Gold Price Outlook we noted that XAU/USD had, “broken below uptrend support,” with the decline, “exposing more meaningful technical support around 1550s.” A break and retest of the 2019 high-day close at 1552 fueled a leg lower in price withgold testing long-term Fibonacci support at 1451 early in the week. Price is poised to mark an outside-day reversal within the weekly opening-range and threatens a near-term recovery heading into the close of the week.
Initial daily resistance stands at 1547/52 with broader bearish invalidation at the monthly open / 61.8% retracement at 1585/86- look for a larger reaction there IF reached. A break lower from here exposes subsequent daily support objectives at the 50% retracement at 1431 and the highlighted trendline confluence near ~1400.
Gold Price Chart - XAU/USD 120min

Notes: A closer look at Gold price action sees XAU/USD continuing to trade within the confines of a descending pitchfork formation we’ve been tracking for weeks now. A failed attempt to break the lower parallel has settled into a contractionary range just above. Yearly open resistance at 1520 backed by the median-line / weekly open at 1529- look for a breach there to shift the near-term focus higher with such a scenario exposing 1552. A downside break of this formation / 1431 could fuel accelerated losses for gold towards longer-term support at 1400 and the 61.8% retracement/2016 high-close at 1367.

Bottom line: The gold price breakdown has responded to a long-term support pivot and the immediate focus is on a break of the initial weekly open range- a break lower from here could see accelerated losses for bullion. From a trading standpoint, the short-bias is vulnerable while above 1431/51 with a topside breach / close above the weekly open needed to suggest a larger recovery is underway. Review my latest Gold Weekly Price Outlook for a closer look at the longer-term XAU/USD technical trading levels.
For a complete breakdown of Michael’s trading strategy, review his Foundations of Technical Analysis series on Building a Trading Strategy
Gold Trader Sentiment – XAU/USD Price Chart
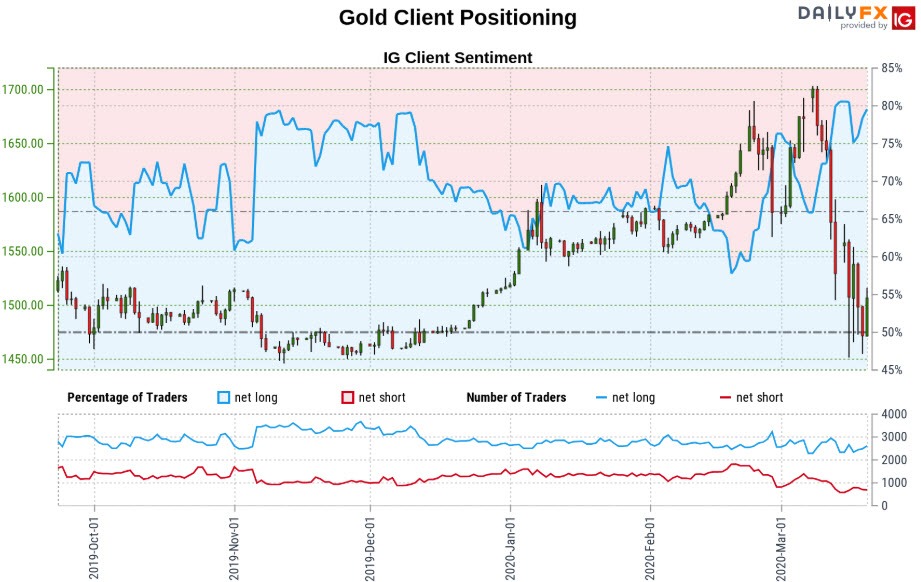
- A summary of IG Client Sentiment shows traders are net-long Gold- the ratio stands at +3.87 (79.45% of traders are long) – bearishreading
- Long positions are10.72% higher than yesterday and 2.89% higher from last week
- Short positions are 13.34% lower than yesterday and 12.70% lower from last week
- We typically take a contrarian view to crowd sentiment, and the fact traders are net-long suggests Gold prices may continue to fall. Traders are further net-long than yesterday and last week, and the combination of current positioning and recent changes gives us a stronger Gold-bearish contrarian trading bias from a sentiment standpoint.
| Change in | Longs | Shorts | OI |
| Daily | -5% | 2% | -2% |
| Weekly | -5% | 14% | 3% |
---
Active Trade Setups
- S&P 500 Price Outlook: Coronavirus Panic Selling Erases Trump Rally
- Sterling Price Outlook: British Pound Heavy on BoE- GBP/USD Support?
- Canadian Dollar Price Outlook: USD/CAD Rally at Risk- NFP Levels
- Written by Michael Boutros, Technical Strategist with DailyFX
Follow Michael on Twitter @MBForex


