


Gold Technical Price Outlook: XAU/USD Near-term Trade Levels
- Gold price updated technical trade levels – Daily & Intraday Charts
- XAU/USD collapses through uptrend support as risk markets plundge on Coronavirus fears
- New to Gold Trading? Get started with this Free How to Trade Gold -Beginners Guide
Gold prices collapsed this week with the yellow metal plummeting to fresh multi-week lows to trade at $1570 ahead of the New York close on Thursday. The decline comes amid a huge spike in volatility and a massive sell-off in broader risk markets with all three major US equity indices probing bear market territory on growing fears of a prolonged Coronavirus global pandemic.
Gold has continued to track markets lower with the sell-off fueling a break of multi-month uptrend support. The decline is now approaching key lateral support just lower and we’re looking for a reaction. These are the updated targets and invalidation levels that matter on the XAU/USD technical charts. Review my latest Weekly Strategy Webinar for an in-depth breakdown of this gold trade setup and more.
Gold Price Chart - XAU/USD Daily
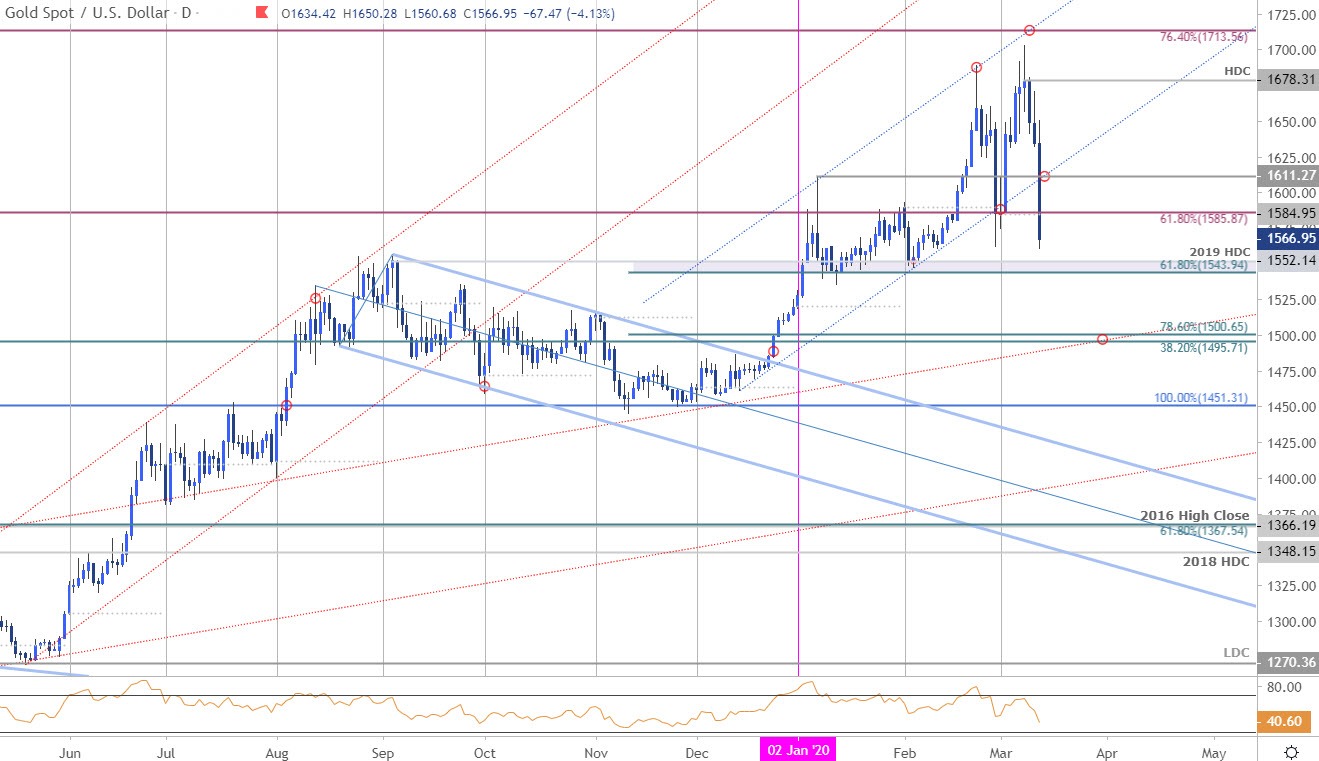
Chart Prepared by Michael Boutros, Technical Strategist; Gold on Tradingview
Technical Outlook: In my last Gold Price Outlook we noted that XAU/USD had, “rebounded off trendline support with the advance now testing uptrend resistance- the immediate advance may be vulnerable heading into 1658/62.” Bullion briefly registered a high at 1703 this week before turning sharply with gold falling more than 8.3% off the highs today. The decline is attempting to break below confluence support at the monthly open / 61.8% retracement at 1584/86 and the focus is on the close today. Initial daily resistance stands at 1611 with a break lower from here exposing key support at the 2019 high-day close / 61.8%b retracement of the November rally at 1543/52.
Gold Price Chart - XAU/USD 120min
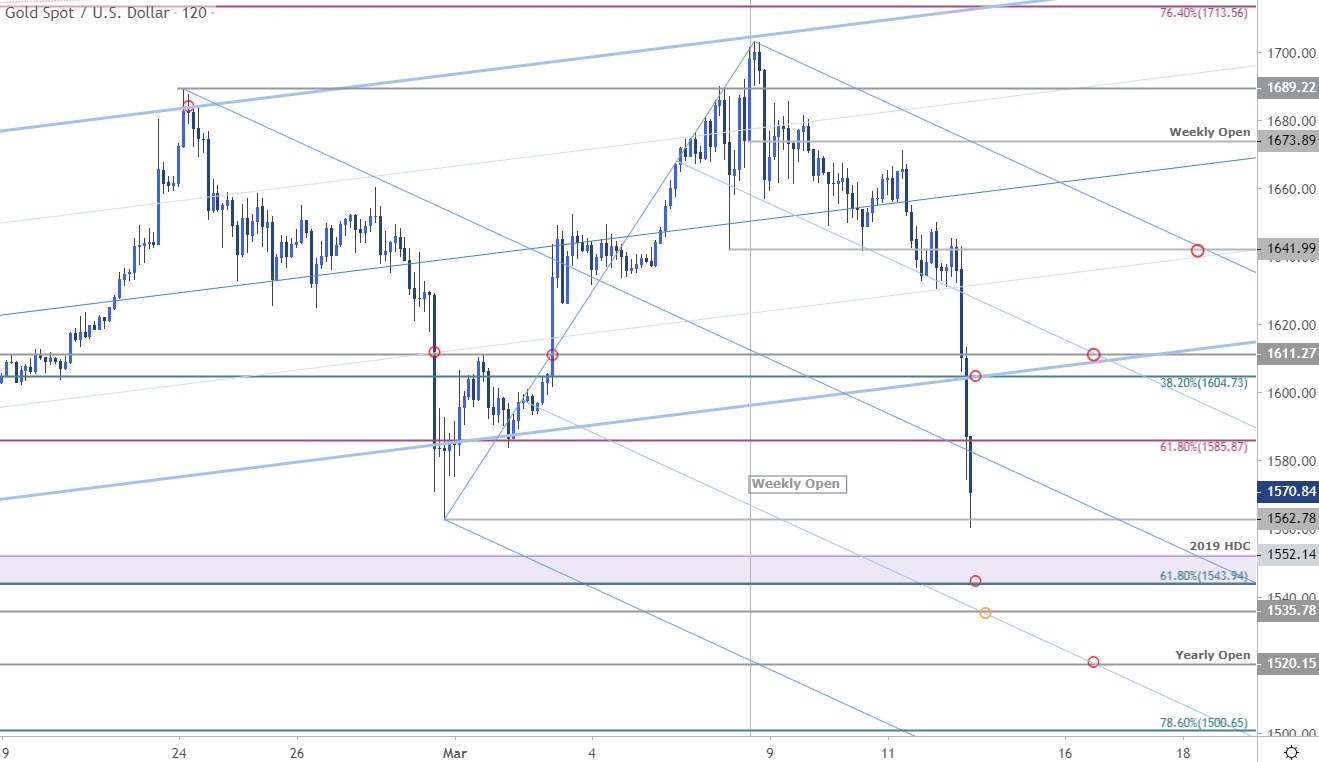
Notes: A closer look at Gold price action sees XAU/USD continuing to trade within the confines of a descending pitchfork formation extending off the yearly highs with today’s decline briefly testing the late-February low at 1562 before rebounding. Initial resistance stands at 1604/11 with near-term bearish invalidation at Friday’s low at 1642. A break lower from here looks for a test of key support at 1543/52- look for a bigger reaction there IF reached with a close below the 25% parallel / 1535 exposing yearly open support at 1520.

Bottom line: Gold prices have broken below uptrend support with the decline now testing initial support targets. Price could see some recovery here, but the broader risk remains weighted to the downside while within this near-term formation. From a trading standpoint, look for price exhaustion ahead of the upper parallel with a break lower exposing more meaningful technical support around 1550s. Review my latest Gold Weekly Price Outlook for a closer look at the longer-term XAU/USD technical trading levels.
For a complete breakdown of Michael’s trading strategy, review his Foundations of Technical Analysis series on Building a Trading Strategy
Gold Trader Sentiment – XAU/USD Price Chart
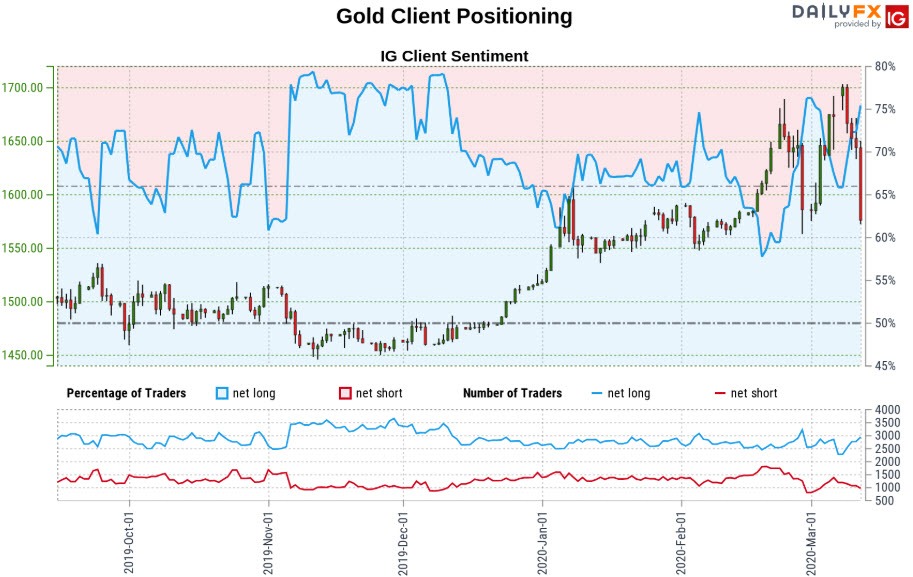
- A summary of IG Client Sentiment shows traders are net-long Gold- the ratio stands at +2.82 (73.85% of traders are long) – bearishreading
- Long positions are14.05% lower than yesterday and 20.09% lower from last week
- Short positions are 19.17% lower than yesterday and 30.49% lower from last week
- We typically take a contrarian view to crowd sentiment, and the fact traders are net-long suggests Gold prices may continue to fall. Yet traders are further net-long than yesterday and last week, and the combination of current positioning and recent changes gives us a stronger Gold-bearish contrarian trading bias sentiment standpoint.
| Change in | Longs | Shorts | OI |
| Daily | 7% | -5% | 1% |
| Weekly | 11% | -9% | 1% |
---
Active Trade Setups
- Sterling Price Outlook: British Pound Heavy on BoE- GBP/USD Support?
- Canadian Dollar Price Outlook: USD/CAD Rally at Risk- NFP Levels
- S&P 500 Price Outlook: Stocks Test Support on Coronavirus- Oversold?
- Oil Price Outlook: Crude Slips into Support– WTI Trade Levels
- Euro Price Outlook: EUR/USD Spirals into Support– Trade Levels
- Written by Michael Boutros, Currency Strategist with DailyFX
Follow Michael on Twitter @MBForex


