


GOLD Technical ANALYSIS – TALKING POINTS:
- Gold prices falter below $1700/oz figure, slide back to trend support
- Dark Cloud Cover candlestick setup, RSI divergence warn of topping
- Retail trader sentiment studies offer mixed cues, bias favors weakness
Gold prices retreated after briefly spiking to a seven-year high just below the $1700/oz figure. The metal is now hovering just above resistance-turned-support in the 1535.03-57.10 area, a barrier reinforced by a rising trend line defining the slope of ascent since mid-2019. Breaking below this threshold may neutralize near-term upward pressure and set the stage for an extension downward.

Gold price daily chart created using TradingView
Zooming out to the weekly chart seems to warn that a reversal downward is in the works. The appearance of a bearish Dark Cloud Cover candlestick pattern speaks topping. Negative RSI divergence bolsters the case for a downside scenario, hinting that upside momentum is running dry. Confirming the reversal still seems to call for a conclusive breach of trend line support.
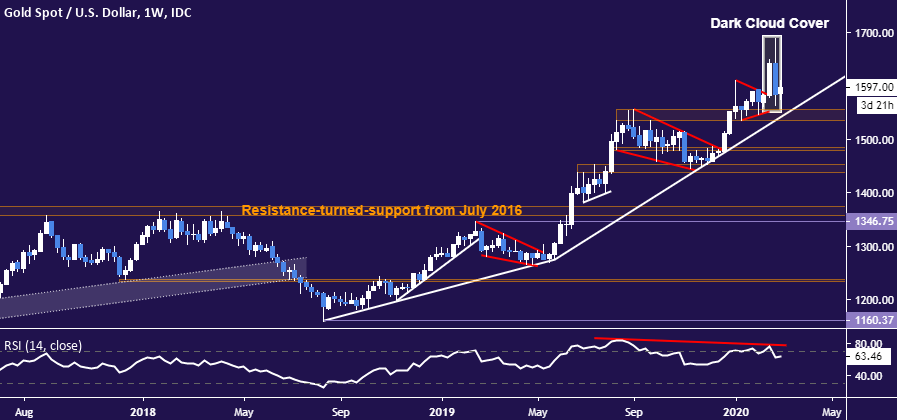
Gold price weekly chart created using TradingView

GOLD TRADER SENTIMENT
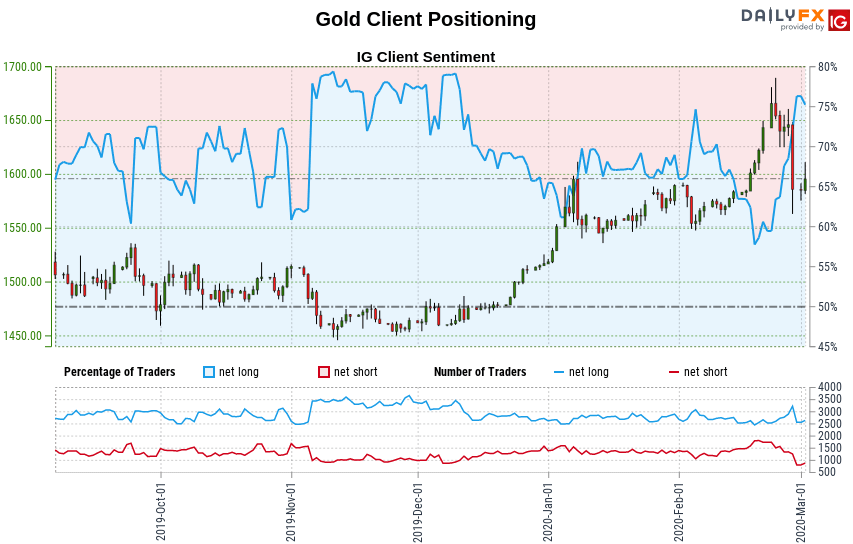
Retail sentiment data shows that 74.29% of traders are net-long, with the long-to-short ratio at 2.89 to 1. The number of traders net-long is 14.27% higher than yesterday and 1.52% lower from last week, while the net-short count is 27.02% higher than yesterday and 37.32% lower from last week.
IG Client Sentiment (IGCS) is typically used as a contrarian indicator, soretail traders being net-long suggests gold prices may continue to decline. However, positioningis less net-long than yesterday even though it is moresocompared with last week.This makes for a clouded sentiment-based outlook.
See the full IGCS sentiment report here.

GOLD TRADING RESOURCES:
- Just getting started? See our beginners’ guide for FX traders
- Having trouble with your strategy? Here’s the #1 mistake that traders make
- Join a free live webinar and have your trading questions answered
--- Written by Ilya Spivak, Currency Strategist for DailyFX.com
To contact Ilya, use the Comments section below or @IlyaSpivak on Twitter


