


Gold - XAU/USD Outlook
- Gold price chart and analysis.
- XAU/USD price action.
Gold – Paused Bearish Momentum
for EUR, USD, Oil and find out for free what might move the price this quarter.
On Wednesday, Gold rallied to $1,478 – its highest level in two weeks. However, the price closed that day with a Doji pattern highlighting market’s indecision.
This week, the Relative Strength Index (RSI) remained flat below 50, reflecting weaker sellers in a bearish market.
Having trouble with your trading strategy? Here’s the #1 Mistake That Traders Make
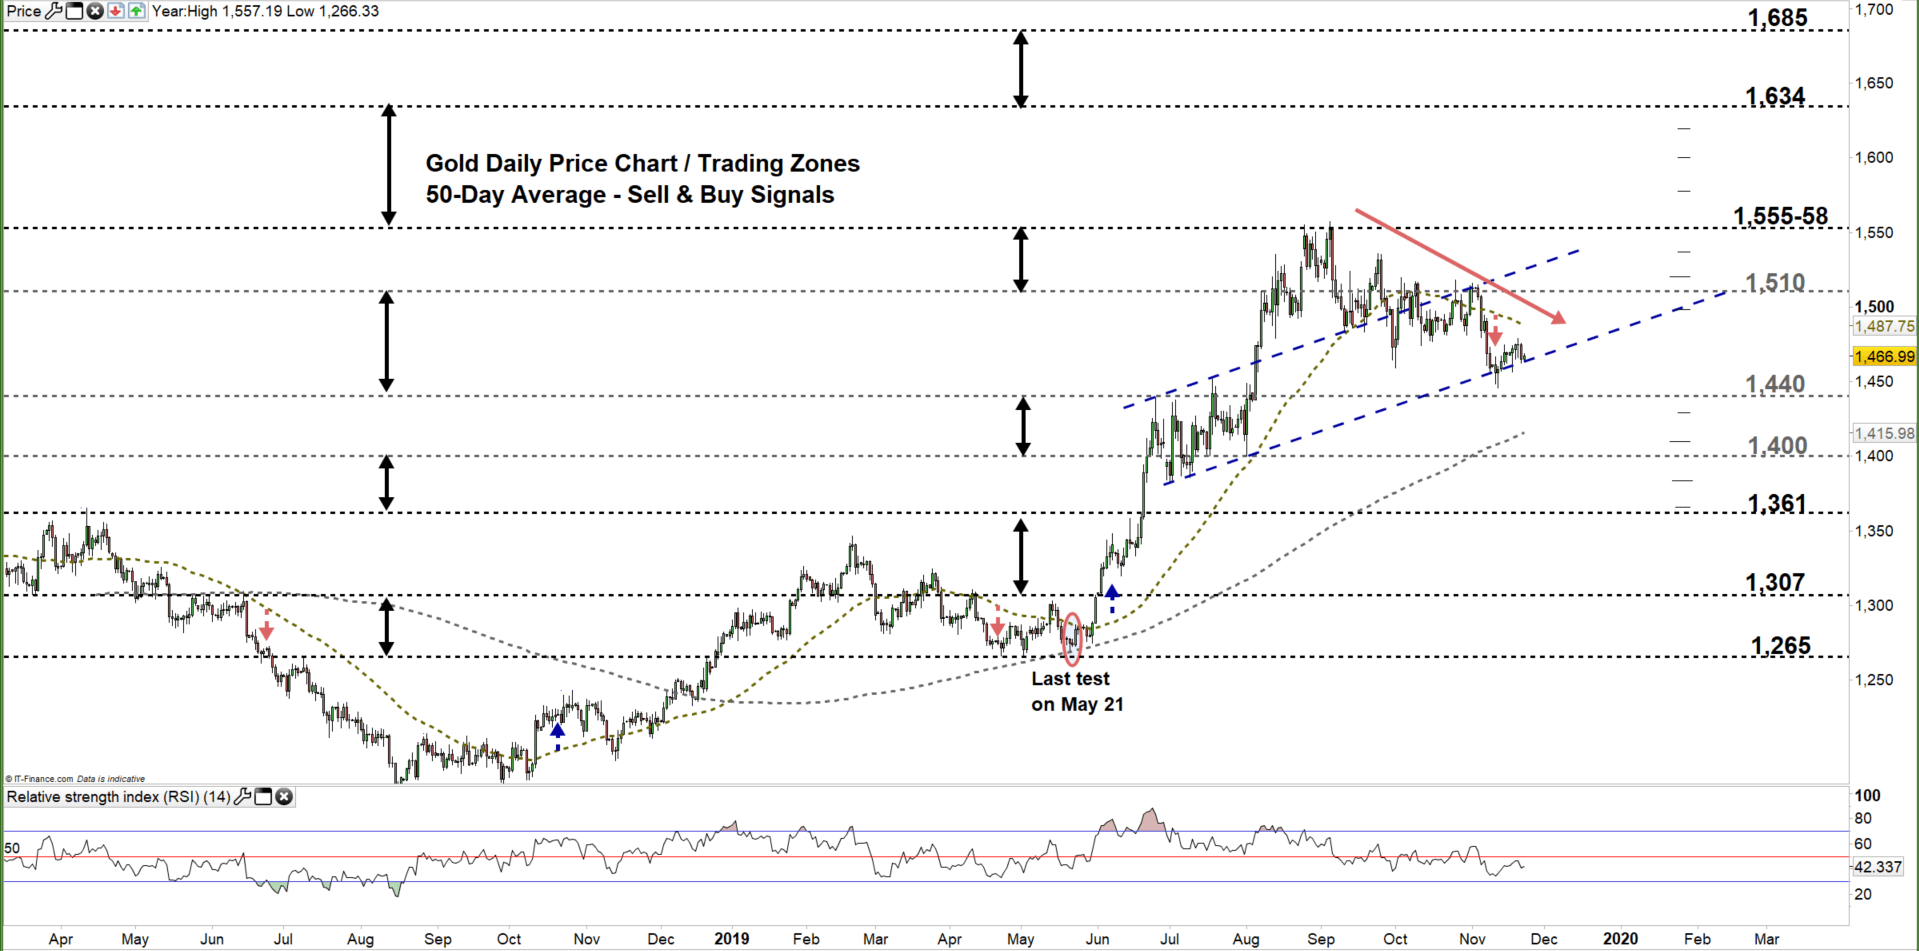
Gold DAILY PRICE CHART (Mar 8, 2018 – Nov 22, 2019) Zoomed out
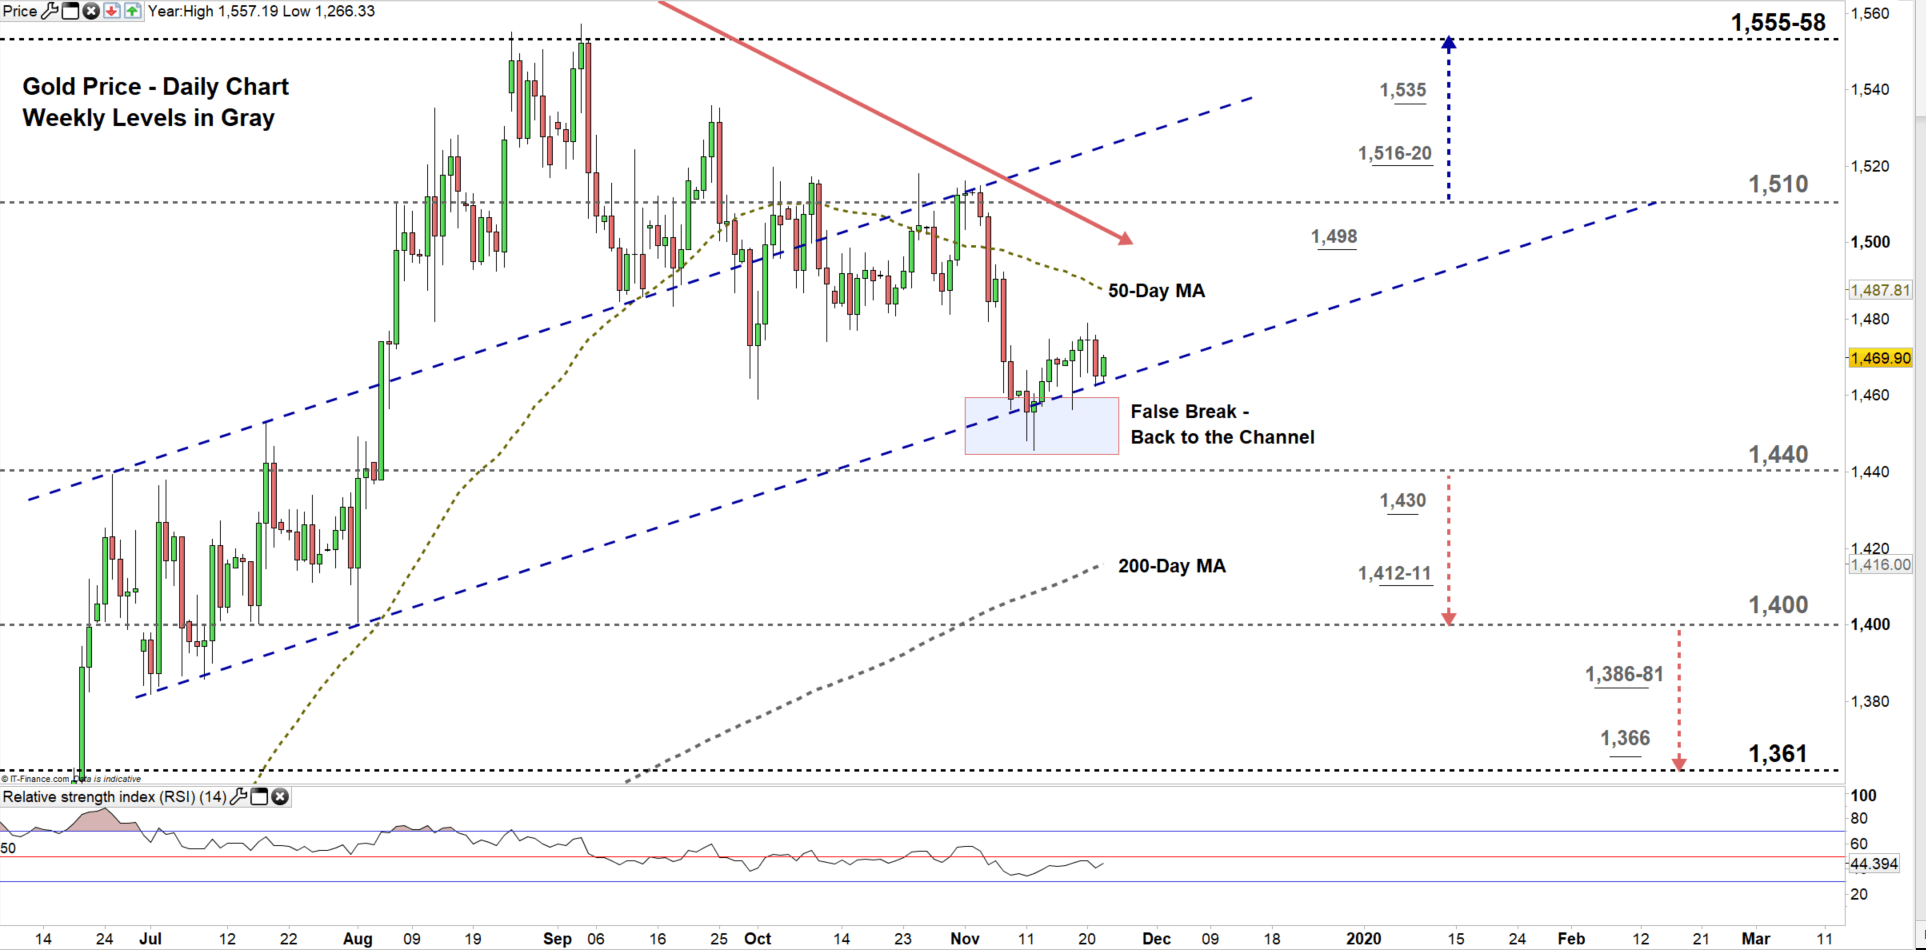
Gold DAILY PRICE CHART (15 JUly – Nov 22, 2019) Zoomed In
Looking at the daily chart, we notice on Monday XAU/USD tested trading outside of upward channel originated form late June discussed in our last update. However, sellers pulled back causing a rally towards the channel’s range.
Today, the price moves in the trading zone entered in Nov 4 ($1,440- $1,510) eying a test of the low end of it. Thus, a close below the low end could entice more sellers to join the market to press towards 200-Day average then $1,400 handle. Yet, the weekly support levels underlined on the chart should be considered.
On the other hand, a failure in closing below the low end of the zone could signal weakness of sellers and may reverse Gold’s direction towards the high end. That said, the resistance levels at $1,474 and 1,498 should be monitored.
Just getting started? See our Beginners’ Guide for FX traders
Gold Four-HOUR PRICE CHART (Oct 22 – Nov 22, 2019)
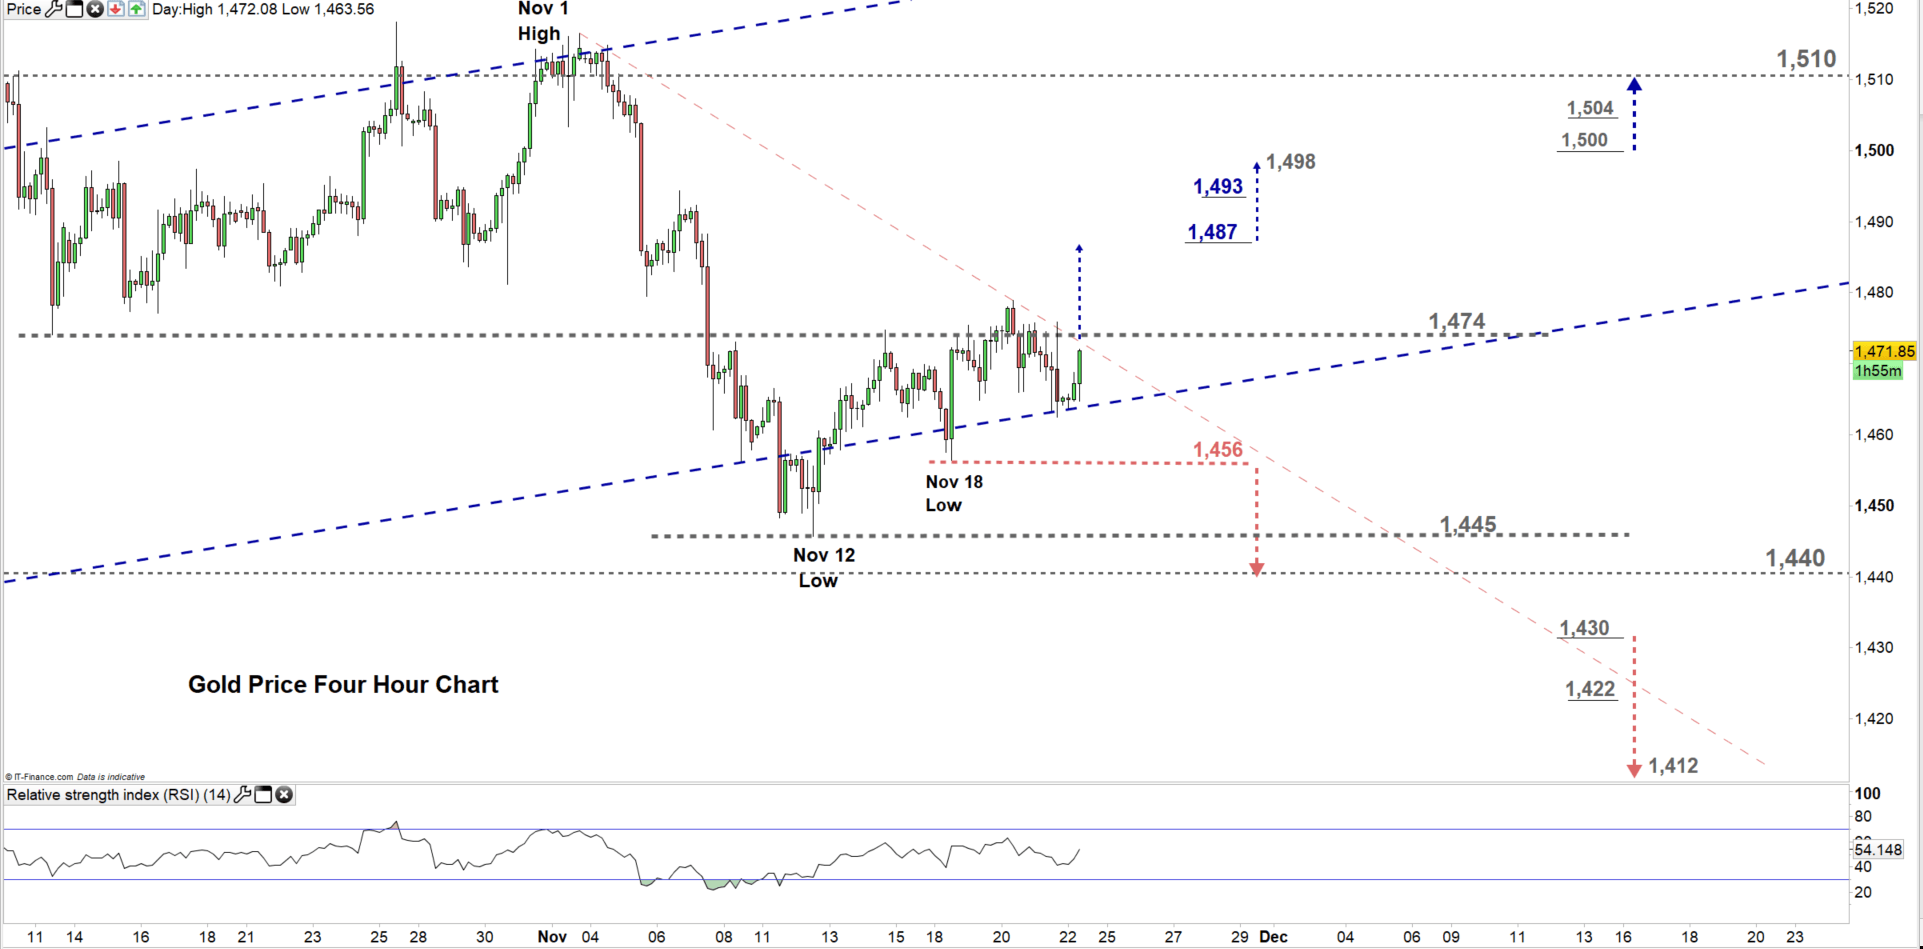
From the four-hour chart, we notice On Wednesday buyers tried lead Gold. However, the precious metal declined then settled below $1,474. Yesterday, they repeated their attempt although, failed to keep the price above the downtrend line originated from Nov 1 high.
Hence, buyers may need a break above $1,487 to push XAU/USD towards $1,498. In that scenario, some could exit the market at the daily resistance level underscored on the chart. In turn, a break below the Nov 18 low at $1,456 could embolden sellers to press Gold towards $1,440. Although, a close attention should be paid to the Nov 12 low marked on the chart.
See the chart to know more about key levels Gold would encounter in a further bullish/bearish scenario.
Join Me on Friday, Nov 22 at 14:00 GMT. In this session we will talk about most common Continuation patterns and how to trade them.
Written By: Mahmoud Alkudsi
Please feel free to contact me on Twitter: @Malkudsi


