


- Gold price reversal testing October trendline resistance- constructive above 1205
- Check out our 3Q projections in our Free DailyFX Gold Trading Forecasts
- Join Michael for Live Weekly Strategy Webinars on Mondays at 12:30GMT
Gold has rallied more than 2.7% off the monthly lows with price now testing resistance at the October trendline. These are the updated targets and invalidation levels that matter on the XAU/USD charts. Review this week’s Strategy Webinar for an in-depth breakdown of this setup and more.
New to Gold Trading? Get started with this Free How to Trade Gold -Beginners Guide
Gold Daily Price Chart (XAU/USD)
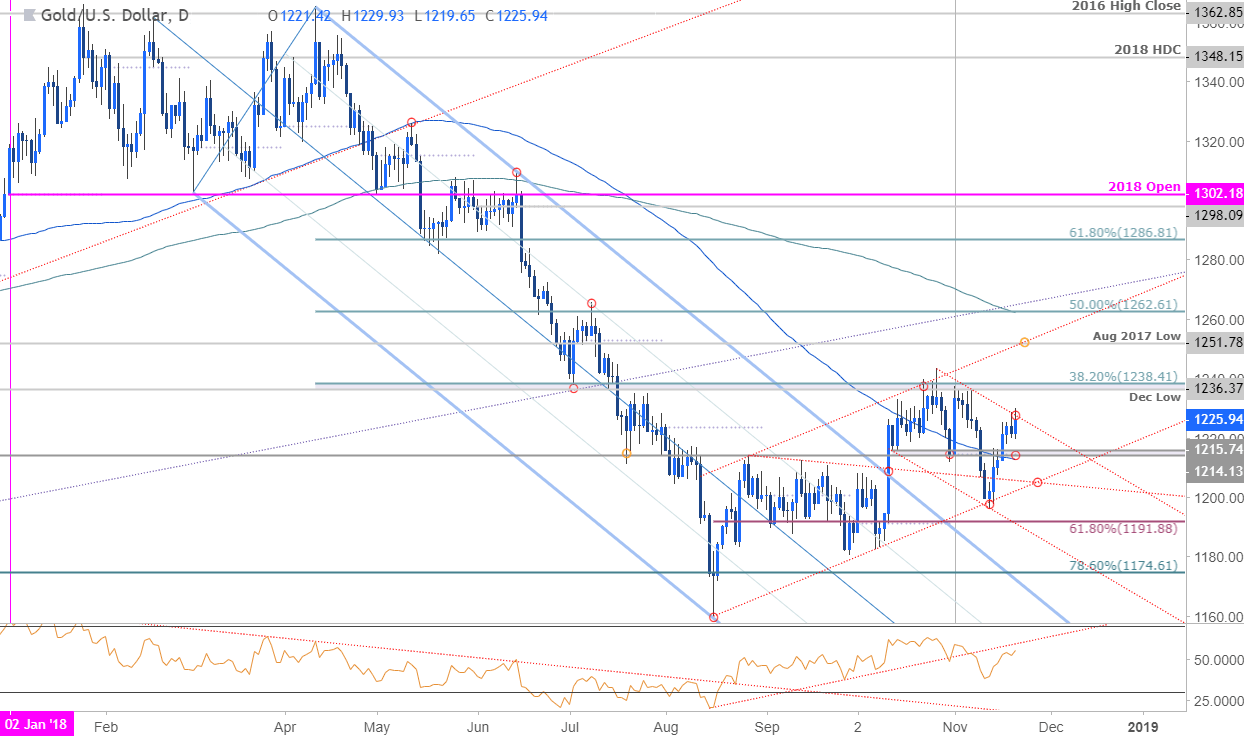
Technical Outlook: In our last Gold Technical Outlook our ‘bottom line’ stated that we were, “looking for evidence / constructive price action to suggest this week’s decline was just a washout with a breach of this near-term formation to offer guidance. From a trading standpoint, I’ll favor fading weakness while above 1203 with near-term bullish invalidation steady at 1201.” Gold rallied into a high at 1229.93 today with the advance struggling at basic trendline resistance extending off the October high.
A daily close above this slope would be needed to keep the immediate focus higher targeting key resistance at the 1236/38 pivot zone. Daily support rests at 1214/16 with broader bullish invalidation at the highlighted trendline confluence near 1205.
Why does the average trader lose? Avoid these Mistakes in your trading
Gold 240min Price Chart (XAU/USD)

Notes: A closer look at price action shows today’s swing high reversing off the median-line for the ascending pitchfork we’ve been tracking in gold off the yearly lows. The immediate support rests with the weekly open at 1221 with near-term bullish invalidation at the weekly opening-range lows at 1217 – a break below this levels risks a drop towards the lower parallels with such a scenario targeting 1209 and 1205.
Learn how to Trade with Confidence in our Free Trading Guide
Bottom line: The recovery off the monthly low is now testing the first major resistance level- failure here would risk a drop back towards the lower parallels but the trade remains constructive while within this formation. From a trading standpoint, a good place to reduce exposure and raise protective stops. For now, I’ll favor fading weakness while above 1214 targeting a breach above the median-line.
For a complete breakdown of Michael’s trading strategy, review his Foundations of Technical Analysis series on Building a Trading Strategy
Gold Trader Sentiment
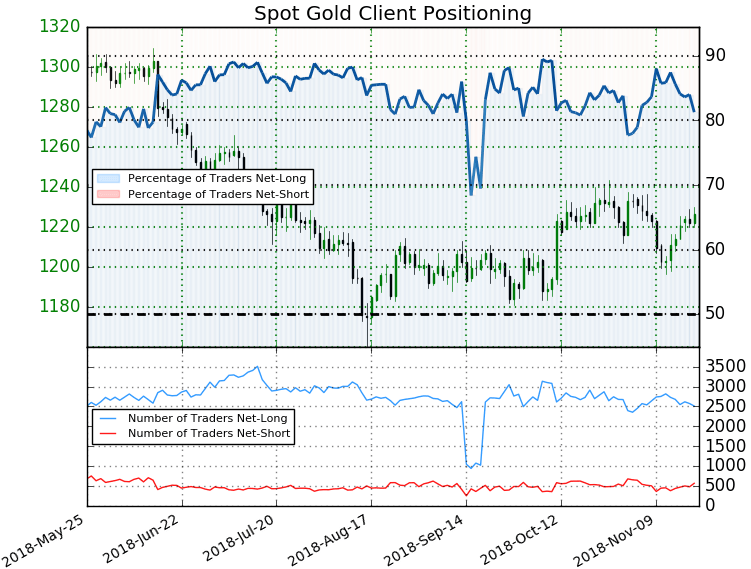
- A summary of IG Client Sentiment shows traders are net-long Gold - the ratio stands at +4.34 (86.3% of traders are long) – bearishreading
- The percentage of traders net-long is now its lowest since November 6th
- Long positions are5.6% lower than yesterday and 14.3% lower from last week
- Short positions are 8.6% higher than yesterday and 17.2% higher from last week
- We typically take a contrarian view to crowd sentiment, and the fact traders are net-long suggests Gold prices may continue to fall. Yet traders are less net-long than yesterday and compared with last week. Recent changes in sentiment warn that the current Spot Gold price trend may soon reverse higher despite the fact traders remain net-long.
See how shifts in Gold retail positioning are impacting trend- Learn more about sentiment!
---
Active Trade Setups
- EUR/USD Price Outlook: Euro Threatens Breakout– Levels to Know
- AUD/JPY Price Outlook: Reversal Run Plummets into Key Support Zone
- NZD/USD Price Outlook: Kiwi Rally Approaching Breakout Targets
- AUD/USD Price Outlook: Aussie Breakout Stalls Ahead of Resistance
- Written by Michael Boutros, Currency Strategist with DailyFX
Follow Michael on Twitter @MBForex or contact him at mboutros@dailyfx.com


