


- Gold prices carve monthly opening range just below slope resistance- breakout pending
- Check out our 3Q projections in our Free DailyFX Gold Trading Forecasts
- Join Michael for Live Weekly Strategy Webinars on Mondays at 12:30GMT
Gold has continued to trade within a well-defined descending formation we’ve been tracking for months now with our immediate focus on a breakout of a multi-week range in price. Here are the updated targets and invalidation levels that matter on the XAU/USD charts heading into next week. Review this week’s Strategy Webinar for an in-depth breakdown of this setup and more.
Gold Daily Price Chart

Technical Outlook: Gold has continued to trade within a broad pitchfork formation extending off the yearly highs with price holding a well-defined range just below parallel resistance into the start of the month. The outlook remains unchanged from our previous Gold Price Technical Outlook where I noted that, “From a trading standpoint, I’ll favor fading weakness while above the median-line at 1180.”
Bullion registered a low precisely at 1180.64 last week before rebounding with the monthly opening-range now taking shape below key slope resistance (blue). We’re looking for a breach / close above this threshold to validate that a more significant low was put in back in August. Note that daily RSI has been unable to clear 50 since the April sell-off and we’ll want to see a change in this behavior to offer further evidence of a shift in the momentum profile.
New to Forex Trading? Get started with this Free Beginners Guide
Gold 240min Price Chart

Notes: A closer look at price action further highlights this multi-week range in gold. The focus is on a break of the 1180-1215 zone with a topside breach favored. A daily lose above would exposed subsequent topside resistance objectives at 1235/38- a region defined by the 100% extension of the advance off the yearly lows, the 38.2% retracement of the April decline and the December low lows- look for a bigger reaction there IF reached.
Initial support rests with the October open at 1191 backed by the trendline confluence just lower at ~1185. Bullish invalidation remains steady at 1180 with a break below the low-day close / 78.6% retracement at 1174 needed to mark resumption of the broader down-trend targeting the median-line at 1160.
Why does the average trader lose? Avoid these Mistakes in your trading
Bottom line: Gold prices are trading within a make-or-break range just below slope resistance to start the month & quarter- look for a break to offer guidance on our medium-term directional bias. That said, from a trading standpoint I’ll favor fading weakness while above 1180 with a breach / close above 1215 needed to validate the breakout. A break below 1174 would shift the focus back towards the yearly lows and subsequent slope support. October promises to be a volatile month for gold prices- buckle up!
For a complete breakdown of Michael’s trading strategy, review his Foundations of Technical Analysis series on Building a Trading Strategy
Gold Trader Sentiment
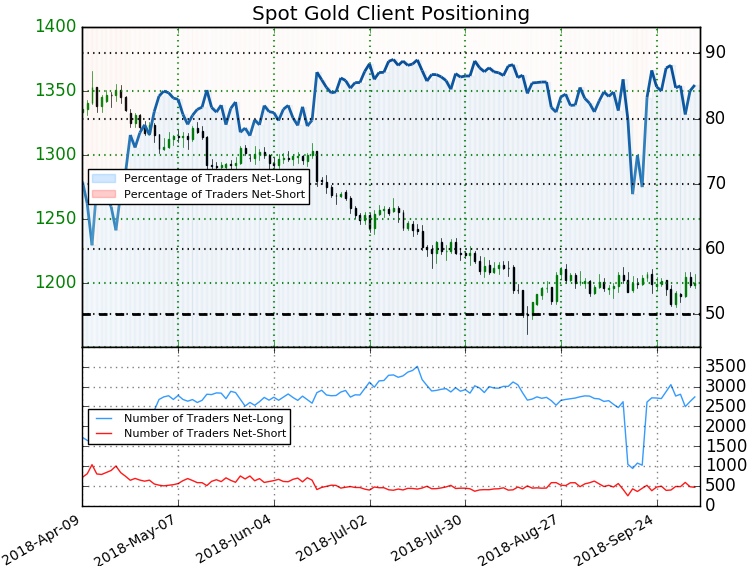
- A summary of IG Client Sentiment shows traders are net-long Gold - the ratio stands at +5.73 (85.1% of traders are long) – bearishreading
- Long positions are5.8% higher than yesterday and 9.8% lower from last week
- Short positions are 11.5% lower than yesterday and 22.3% higher from last week
- We typically take a contrarian view to crowd sentiment, and the fact traders are net-long suggests Spot Gold prices may continue to fall. However, traders are more net-long than yesterday but less net-long from last week andthe combination of current positioning and recent changes gives us a further mixed Spot Gold trading bias from a sentiment standpoint.
See how shifts in Gold retail positioning are impacting trend- Learn more about sentiment!
Economic Calendar - latest economic developments and upcoming event risk. Learn more about how we Trade the News in our Free Guide !
Active Trade Setups
- Canadian Dollar Price Outlook: Trading the USD/CAD Breakdown
- USD/JPY Price Outlook: Yen Decision Time as Rally Tests Yearly Highs
- Written by Michael Boutros, Currency Strategist with DailyFX
Follow Michael on Twitter @MBForex or contact him at mboutros@dailyfx.com


