


Talking Points:
- Gold prices have sold off rather aggressively after visiting a key zone of resistance last Friday, falling down to the ‘s3’ area of support that we’ve been following around $1,327.05.
- While the bullish trend remains, the momentum with which this retracement has shown is undeniable, and this opens the door to setups on both sides of Gold prices.
- Are you looking to improve your trading approach? Check out Traits of Successful Traders. And if you’re looking for an introductory primer to the Forex market, check out our New to FX Guide.
To receive James Stanley’s Analysis directly via email, please sign up here
Gold Prices Show Resistance Shows at Key Zone
Last Friday, we looked at the V-shaped reversal that showed-up in Gold prices in the month of February. After coming into the month driving-lower as USD-strength was starting to show, prices caught a bit of support around $1,307.50; and quickly made an advance towards a group of prior highs. The resistance zone that we were looking at on Friday is very simple, comprised of the distance from the 2017 high at $1,357.50 up to the newly-minted 2018 high at $1,366.06.
Gold Daily Chart: Gold Prices Fall From Key Resistance Zone (2017-2018 Highs)
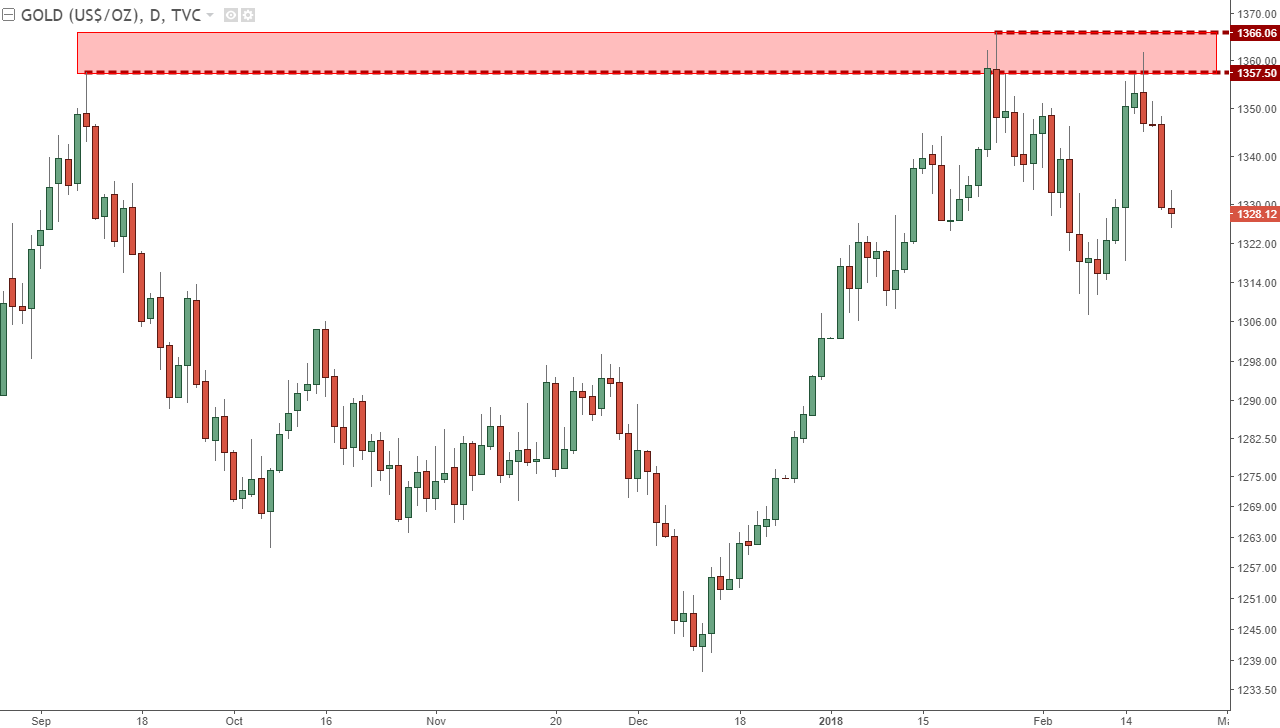
Chart prepared by James Stanley
In our last article, we retained a cautiously bullish stance, looking for deeper support tests for establishing bullish exposure. We were looking at three potential support levels, and while a minor bounce has developed off of or around each, bears have largely remained in control as lower-lows and lower-highs continue to show up. At this stage, we’re seeing bulls attempting to cauterize support at the ‘s3’ level that we had looked at around $1,327.05.
Gold Hourly Chart: Gold Prices Putting in Lower-Lows, Highs While Walking Down Support
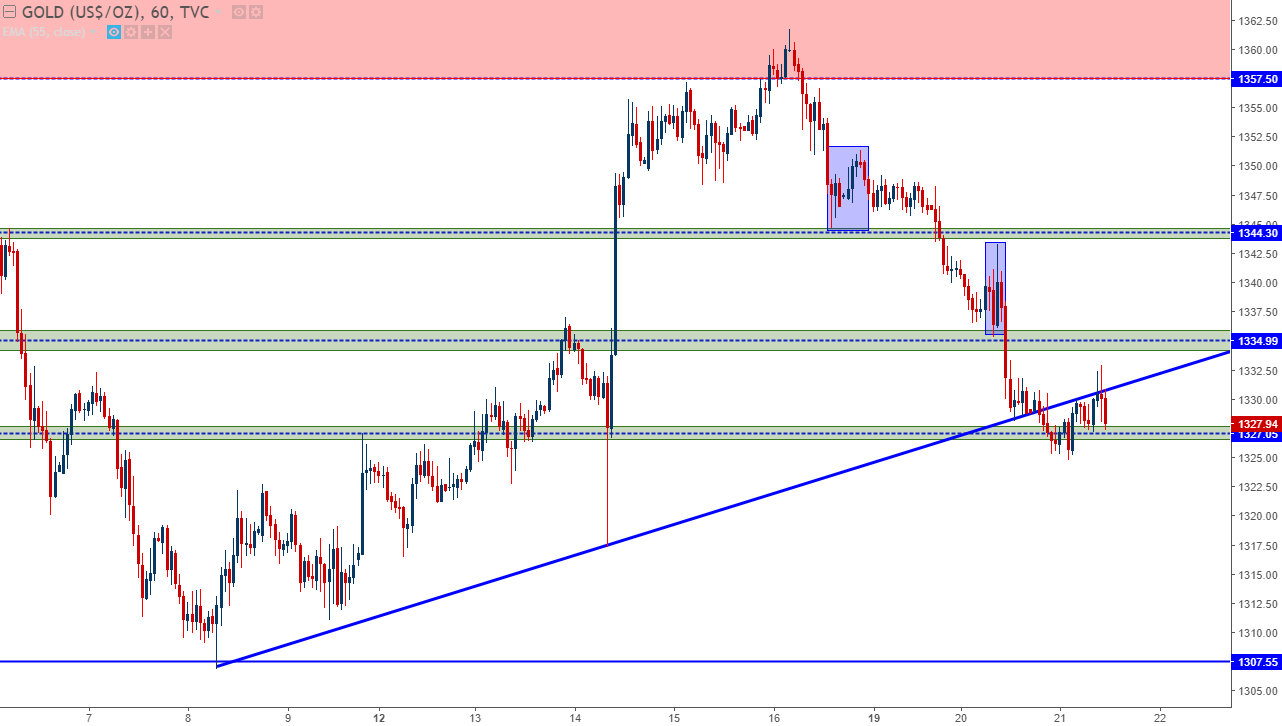
Chart prepared by James Stanley
The Dollar is in the Driver’s Seat
The primary complication with a short-side stance in Gold at the moment is that the US Dollar is bucking up against resistance, and there are more resistance levels on the horizon. While this doesn’t preclude a continuation of the bullish advance in the Greenback, it would still be very early to prognosticate that as anything more than a retracement in the year-long bearish trend; so this bearish stance in Gold would be short-term in nature, at least for now.
At this point – there are setups on both sides of Gold. On the bearish side, the possibility of stops above this morning’s swing-highs opens the door for short-side targets around prior swings of $1,317 and $1,307. On the bullish side – traders would likely want to confirm that this support around $1,324.75 may hold, which can open the door to bullish setups with stops below this morning’s swing-low, targeting prior areas of interest around $1,335.
For those with longer-term stances or more conservative profiles, standing clear until a more attractive setup presents itself could be a more attractive way of treating current price action in Gold.
Gold Hourly: Gold Prices Trying to Dig-Out Support, but Bears Remain In-Control
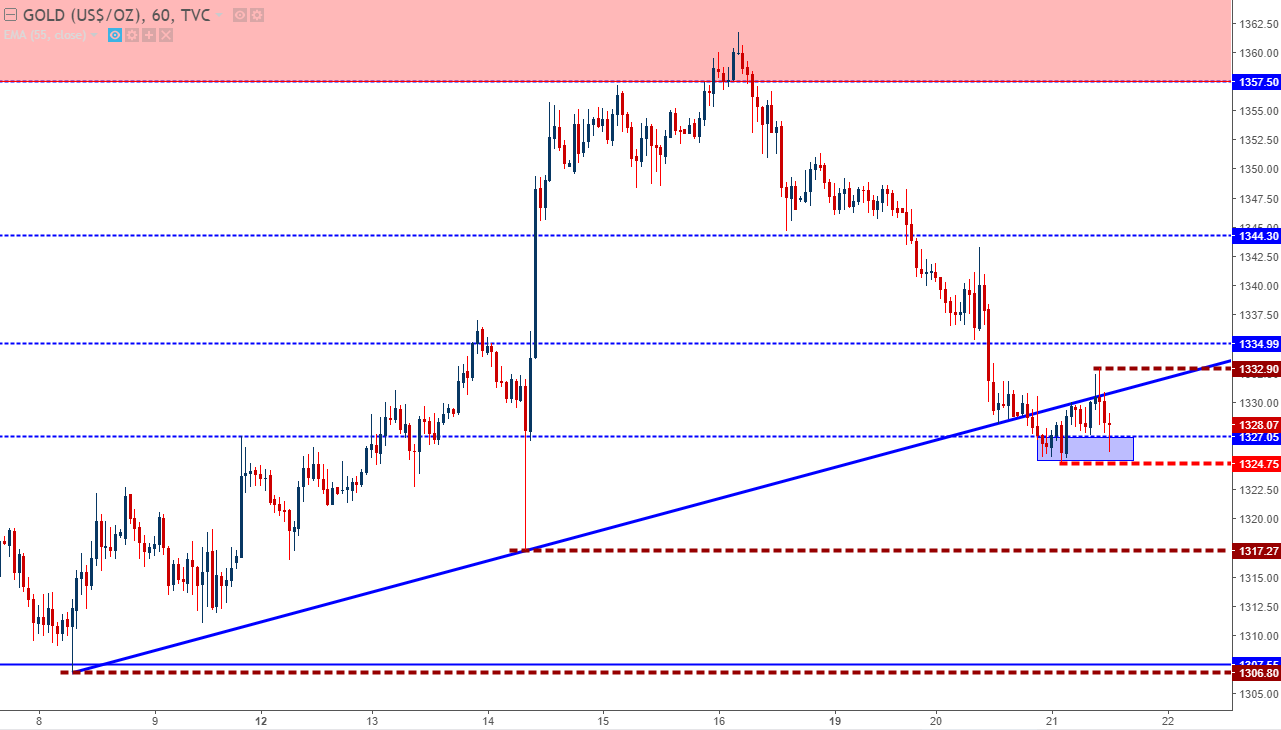
Chart prepared by James Stanley
To read more:
Are you looking for longer-term analysis on Gold prices? Our DailyFX Forecasts for Q1 have a section specifically for Gold. We also offer a plethora of resources on our Gold page, and traders can stay up with near-term positioning via our IG Client Sentiment Indicator.
--- Written by James Stanley, Strategist for DailyFX.com
To receive James Stanley’s analysis directly via email, please SIGN UP HERE
Contact and follow James on Twitter: @JStanleyFX


