


Gold XAU/USD Forecast
Check our Q4 forecasts for EUR, USD, Oil and find out for free what might move the price this quarter.
Gold Price – Slower Downside Momentum
On Nov 18, Gold created a higher low at $,1456 slowing down current downtrend move. On Monday, XAU/USD opened with a downside gap. However, sellers have not been able yet to revisit the Nov 12 low at $1,445 signaling more hesitation.
Alongside this, the Relative Strength Index (RSI) remained flat below 50, reflecting weaker sellers in a bearish market.
Having trouble with your trading strategy? Here’s the #1 Mistake That Traders Make
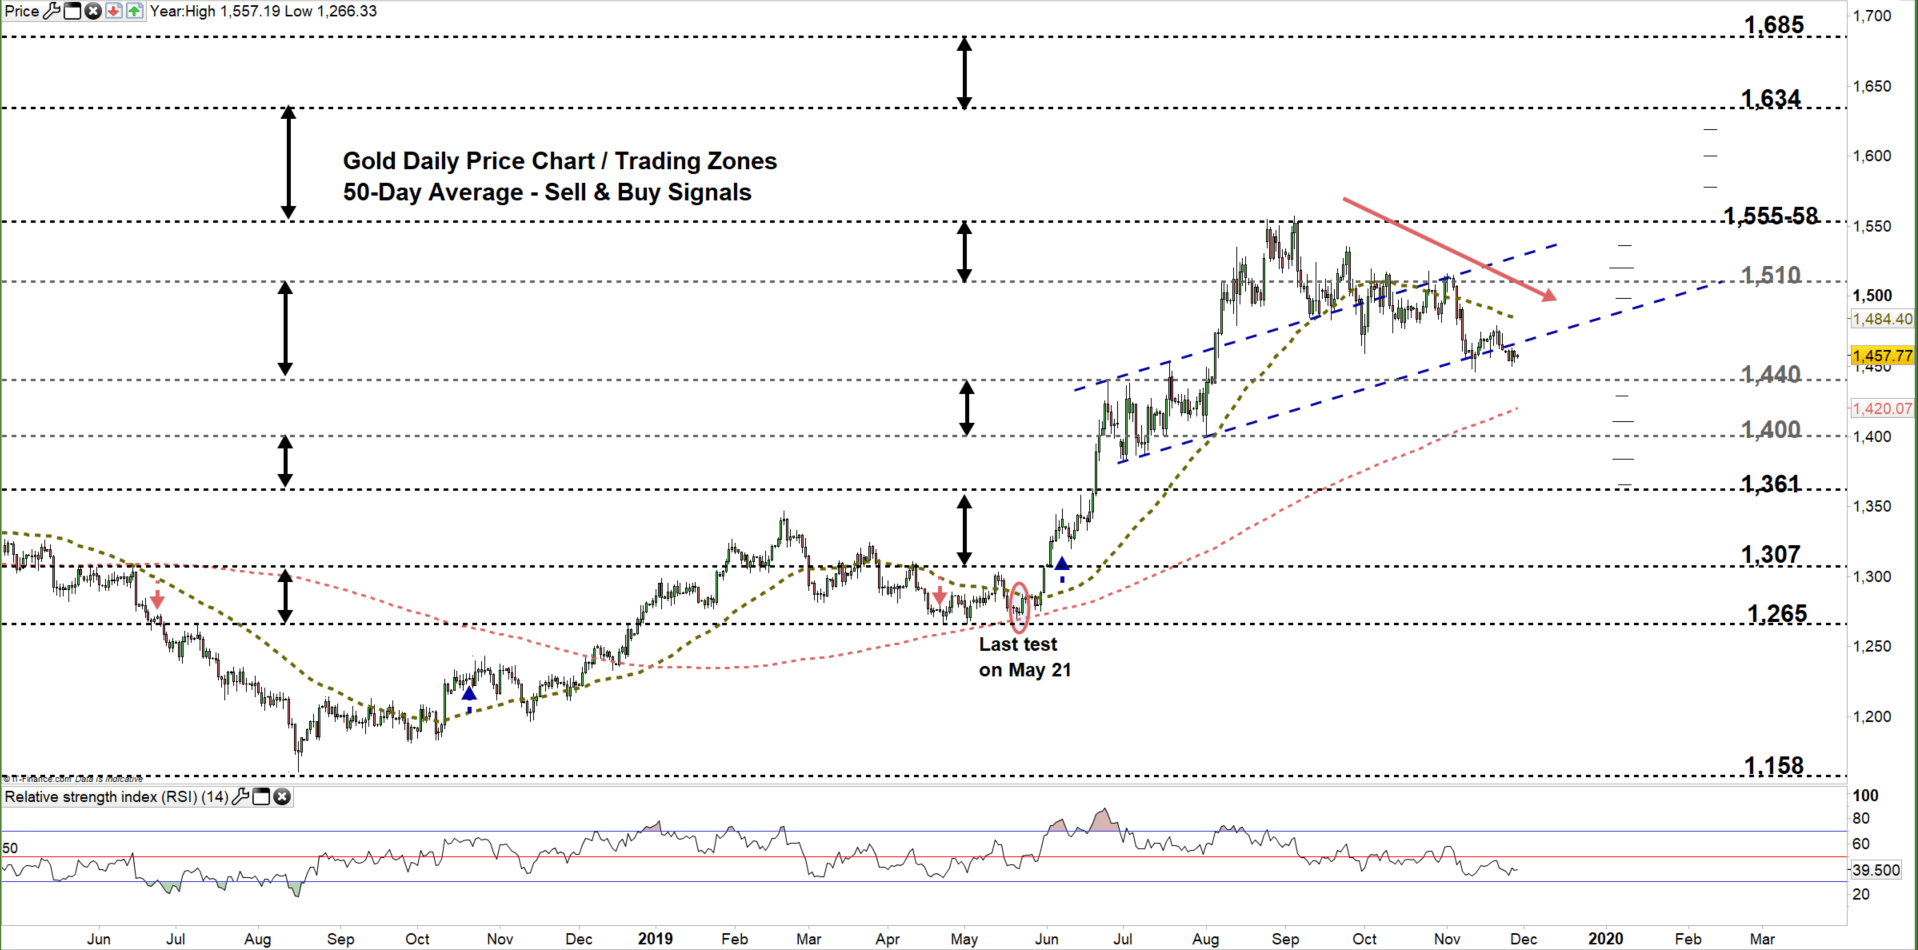
Gold DAILY PRICE CHART (April 8, 2018 – Nov 28, 2019) Zoomed out
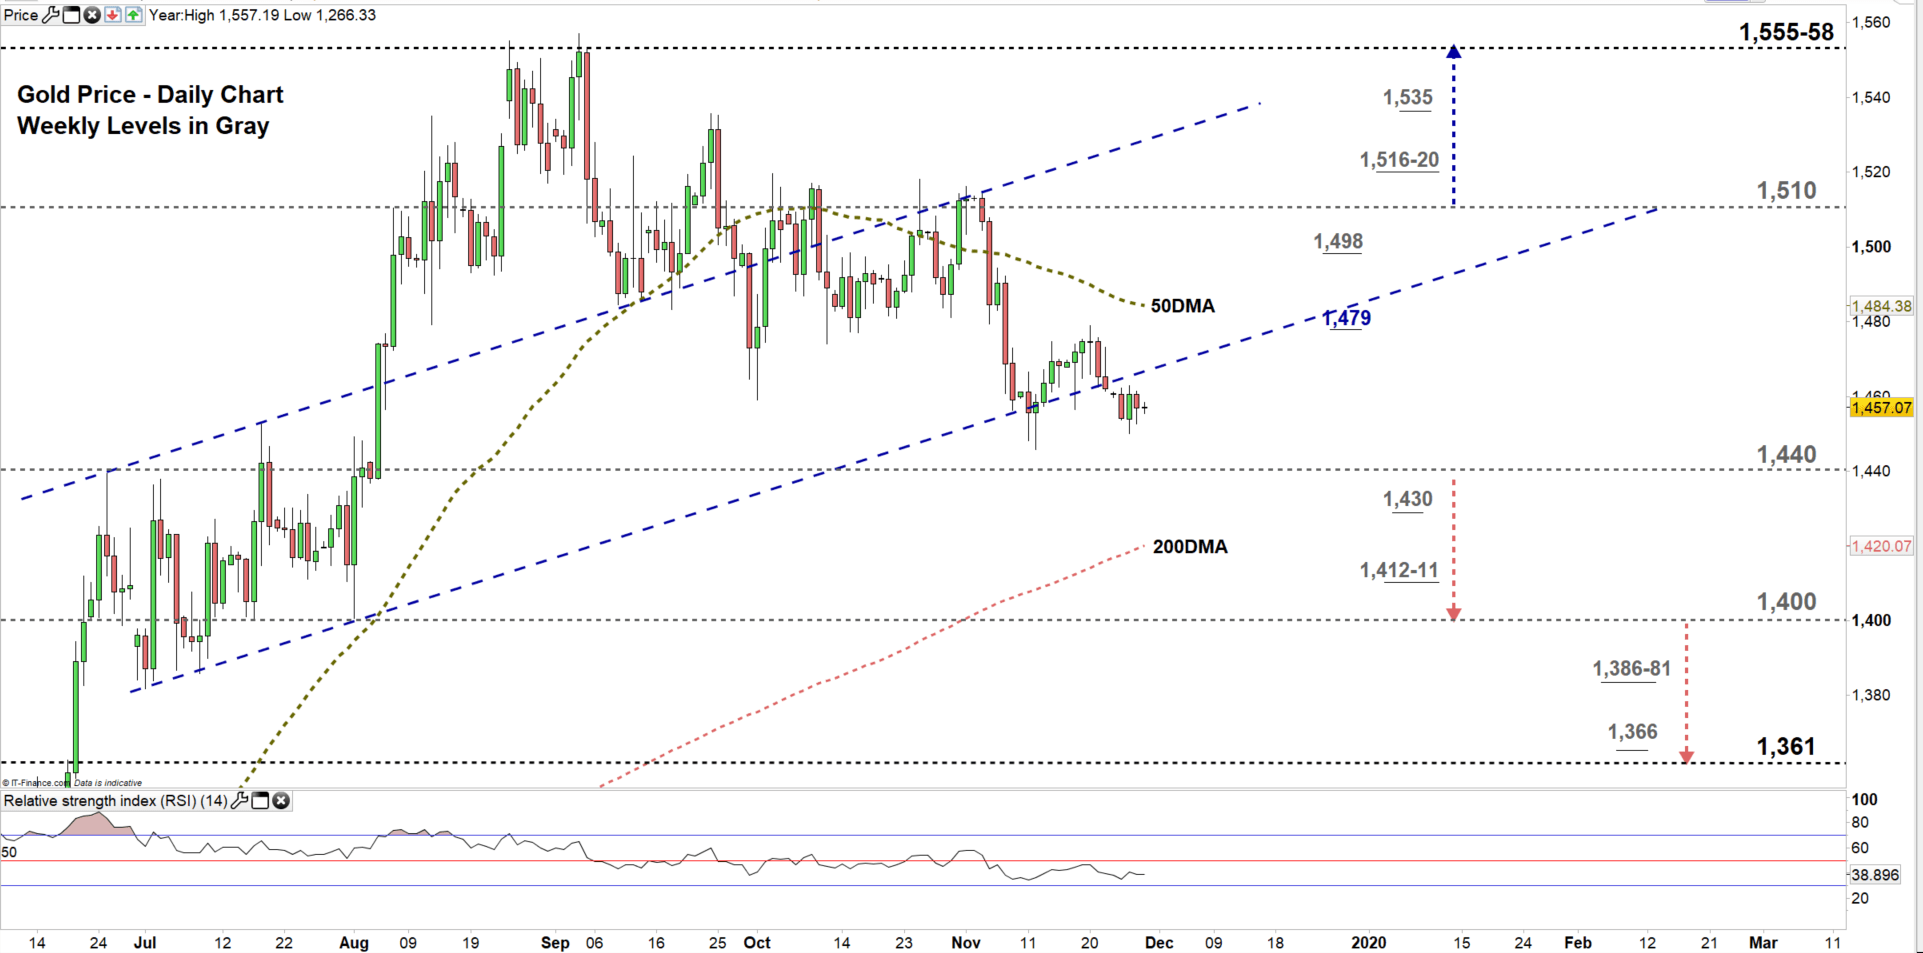
Gold DAILY PRICE CHART (15 June – Nov 28, 2019) Zoomed In
Looking at the daily chart, we notice on Friday Gold abandoned the uptrend channel originated from early July, generating a significant bearish signal.
Today, the price is still moving in the trading zone entered in Nov 4 ($1,440- $1,510). Sellers look to send the price for a test of the low end of it. Thus, a close below the low end could entice more sellers to join the market to press towards 200-Day average then $1,400 handle. Yet, the weekly support levels underlined on the chart (zoomed in) should be considered.
On the other hand, a failure in closing below the low end of the zone would mean a potential pullback as sellers take profit i.e. XAU/USD could reverse course towards the high end. That said, the daily and weekly resistance levels underscored on the chart should be monitored.
Just getting started? See our Beginners’ Guide for FX traders
Gold Four-HOUR PRICE CHART (Oct 22 – Nov 28, 2019)
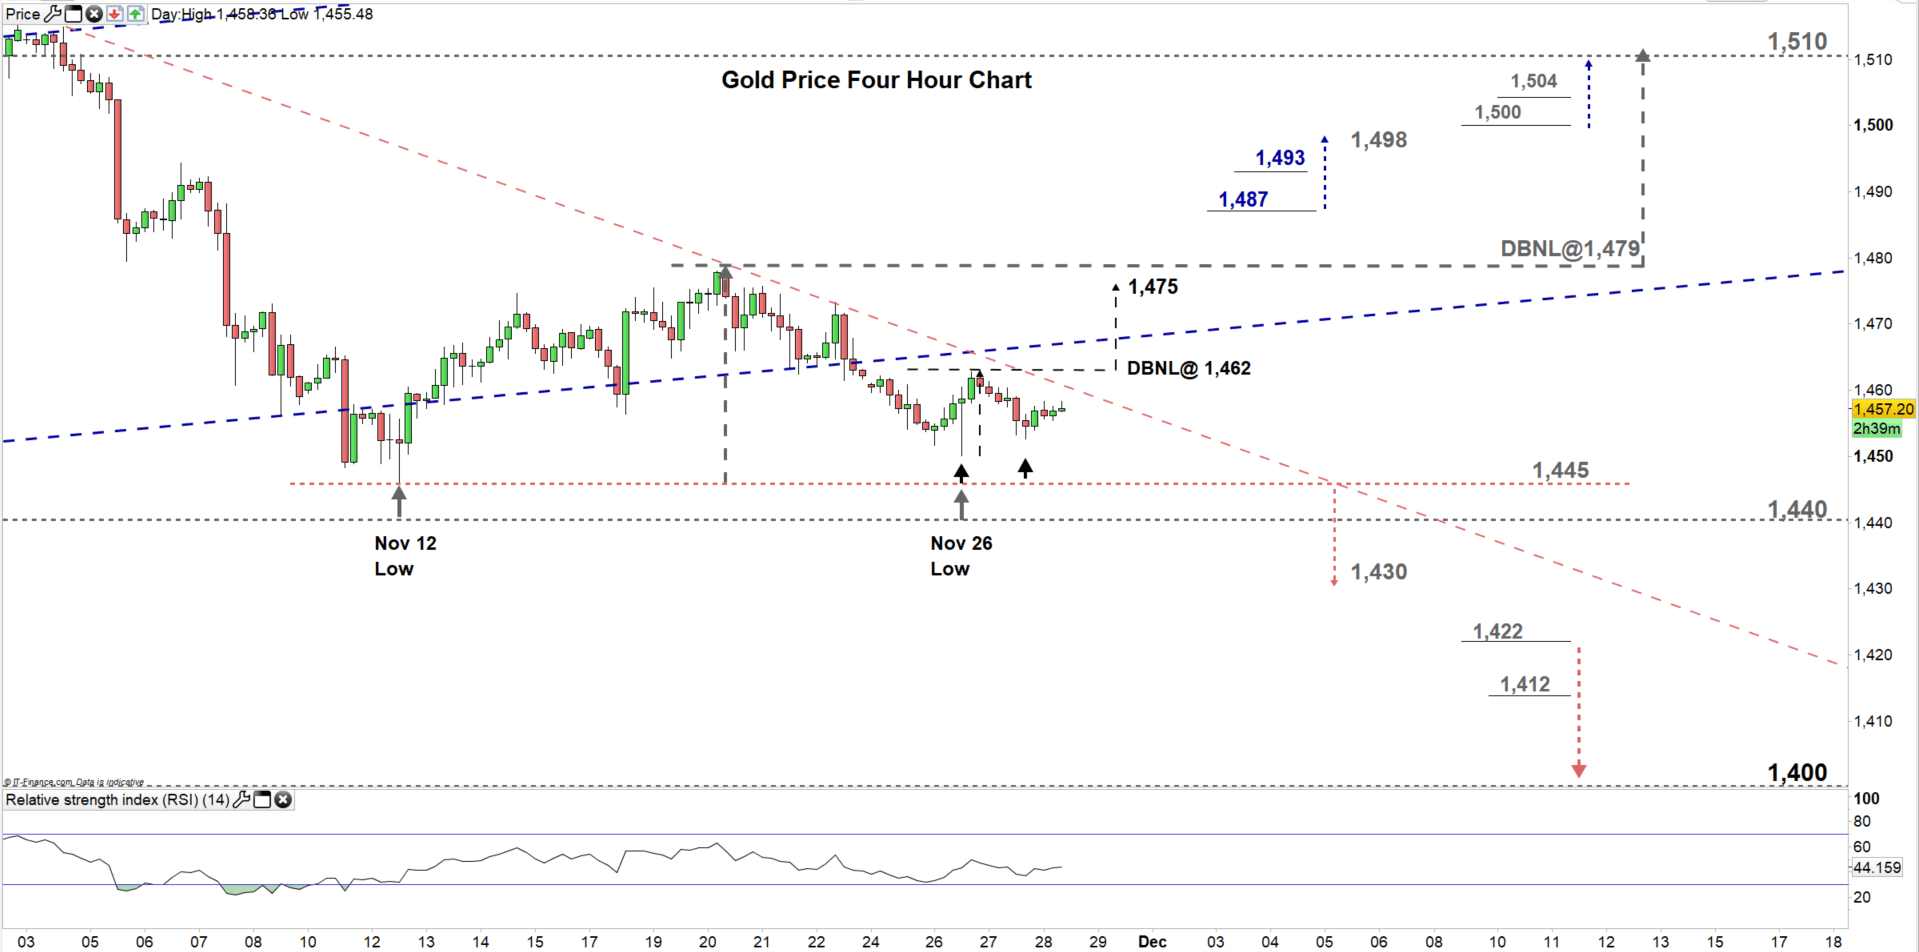
From the four-hour chart, we notice on Nov 26 Gold rebounded from $1,450 then rallied and started to develop two double bottom patterns. The first pattern eyes a test of $1,475 contingent on breaking and remaining above the neckline located at $1,462. The neckline of the second pattern resides at $1,479. Thus, if the price breaks and remain above this suggest a rally towards $1,510.
A break above $1,487 could be an additional signal for buyers to push towards $1,498. Although, some buyers may take profit at $1,493. On the other hand, a break below $1,445 could resume XAU/USD price action towards $1,430. Yet, some sellers may take profit at the low end of current trading zone discussed above on the daily chart.
See the chart to know more about key levels Gold would encounter in a further bullish/bearish scenario.
Join Me on Friday, DEC 6 at 14:00 GMT. In this session we will talk about most common directional and momentum indicators and how to use them
Written By: Mahmoud Alkudsi
Please feel free to contact me on Twitter: @Malkudsi


