


Crude Oil Outlook:
- Crude oil prices have traded through and sustained a move above multi-month range resistance.
- OPEC+ production increases are meager, and China moving away from zero-COVID – if only temporarily – means demand will increase rapidly.
- According to the IG Client Sentiment Index, crude oil prices have a mixed bias in the near-term.
Trade Smarter - Sign up for the DailyFX Newsletter
Receive timely and compelling market commentary from the DailyFX team
OPEC+ and China
Crude oil prices have sustained their recent move higher following news that OPEC+ would increase oil production in July and August by +648,000 barrels per day. However, questions linger about whether or not OPEC+ countries will be able to meet those expectations, as few OPEC+ members have spare capacity to increase oil production in the short-term.
Coupled with signs that China’s zero-COVID strategy is abating – at least for now – it appears that the supply-demand imbalance is back in focus: there’s not enough supply, and demand is starting to rise again. These factors may have helped crude oil prices break above resistance of their multi-month range, and suggest that a more bullish technical outlook is appropriate for the foreseeable future.

Oil Volatility, Oil Price Correlation Remains Weak
Crude oil prices have a relationship with volatility like most other asset classes, especially those that have real economic uses – other energy assets, soft and hard metals, for example. Similar to how bonds and stocks don’t like increased volatility – signaling greater uncertainty around cash flows, dividends, coupon payments, etc. – crude oil tends to suffer during periods of higher volatility. The normalization of the relationship between crude oil prices and crude oil volatility may not last long, however, if supply chain issues and the supply-demand imbalance remains in focus.
OVX (Oil Volatility) Technical Analysis: Daily Price Chart (June 2021 to June 2022) (Chart 1)
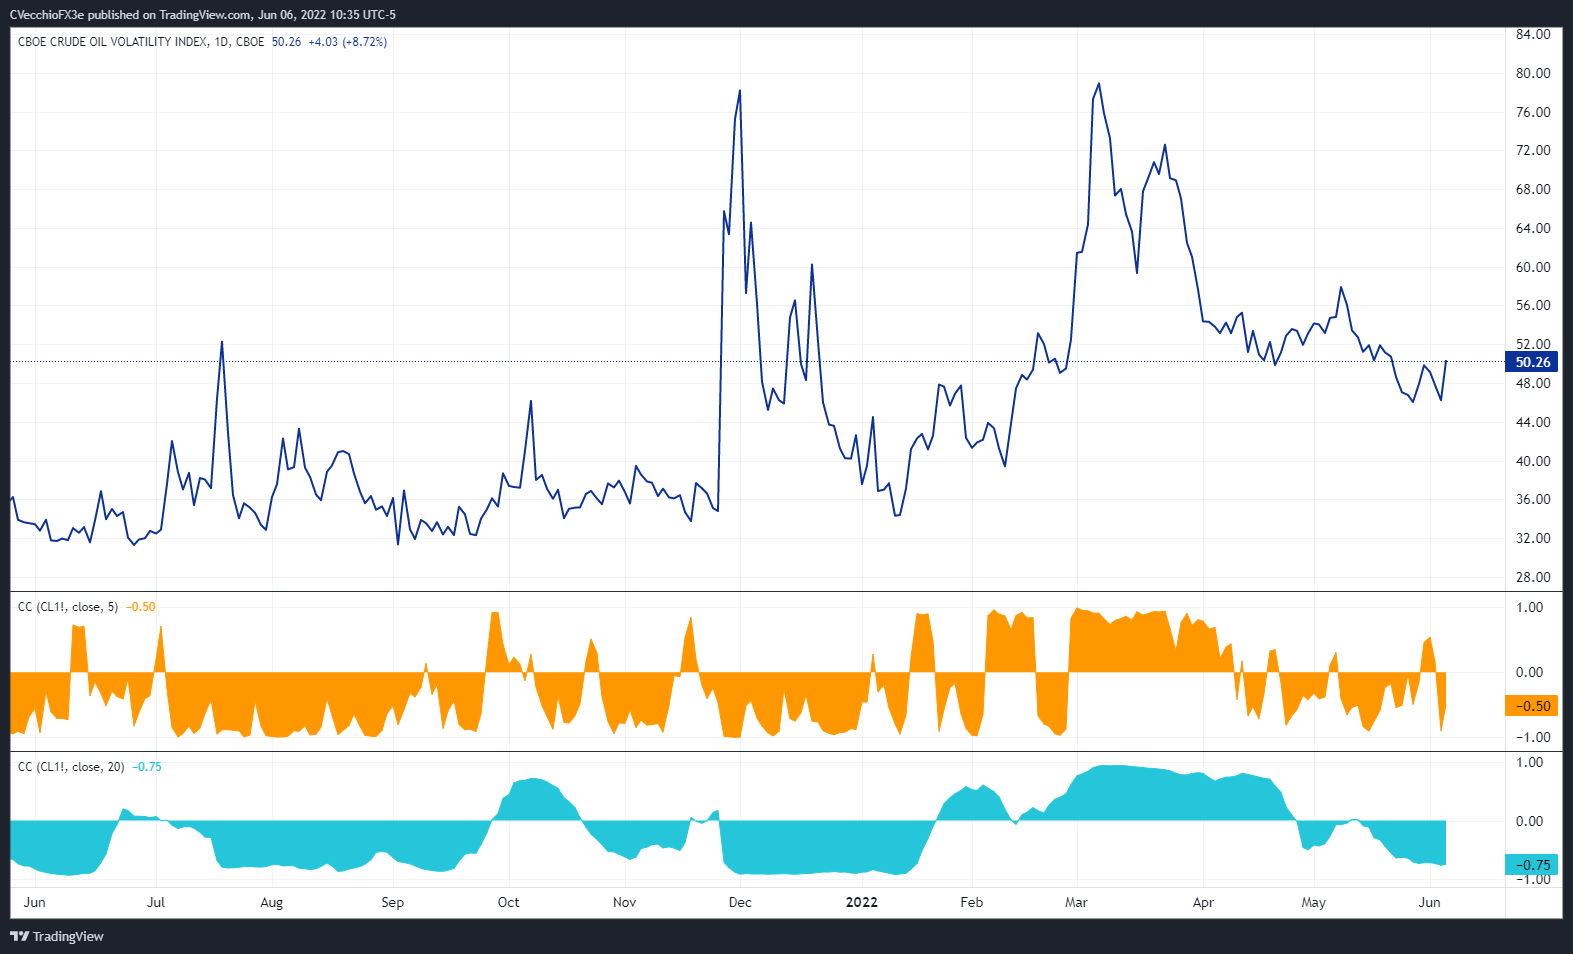
Oil volatility (as measured by the Cboe’s gold volatility ETF, OVX, which tracks the 1-month implied volatility of oil as derived from the USO option chain) was trading at 50.26 at the time this report was written, having held steady for the past six weeks. The 5-day correlation between OVX and crude oil prices is -0.50 while the 20-day correlation is -0.75. One week ago, on May 31, the 5-day correlation was +0.45 and the 20-day correlation was -0.73.

Crude Oil Price Technical Analysis: Daily Chart (October 2020 to June 2022) (Chart 2)
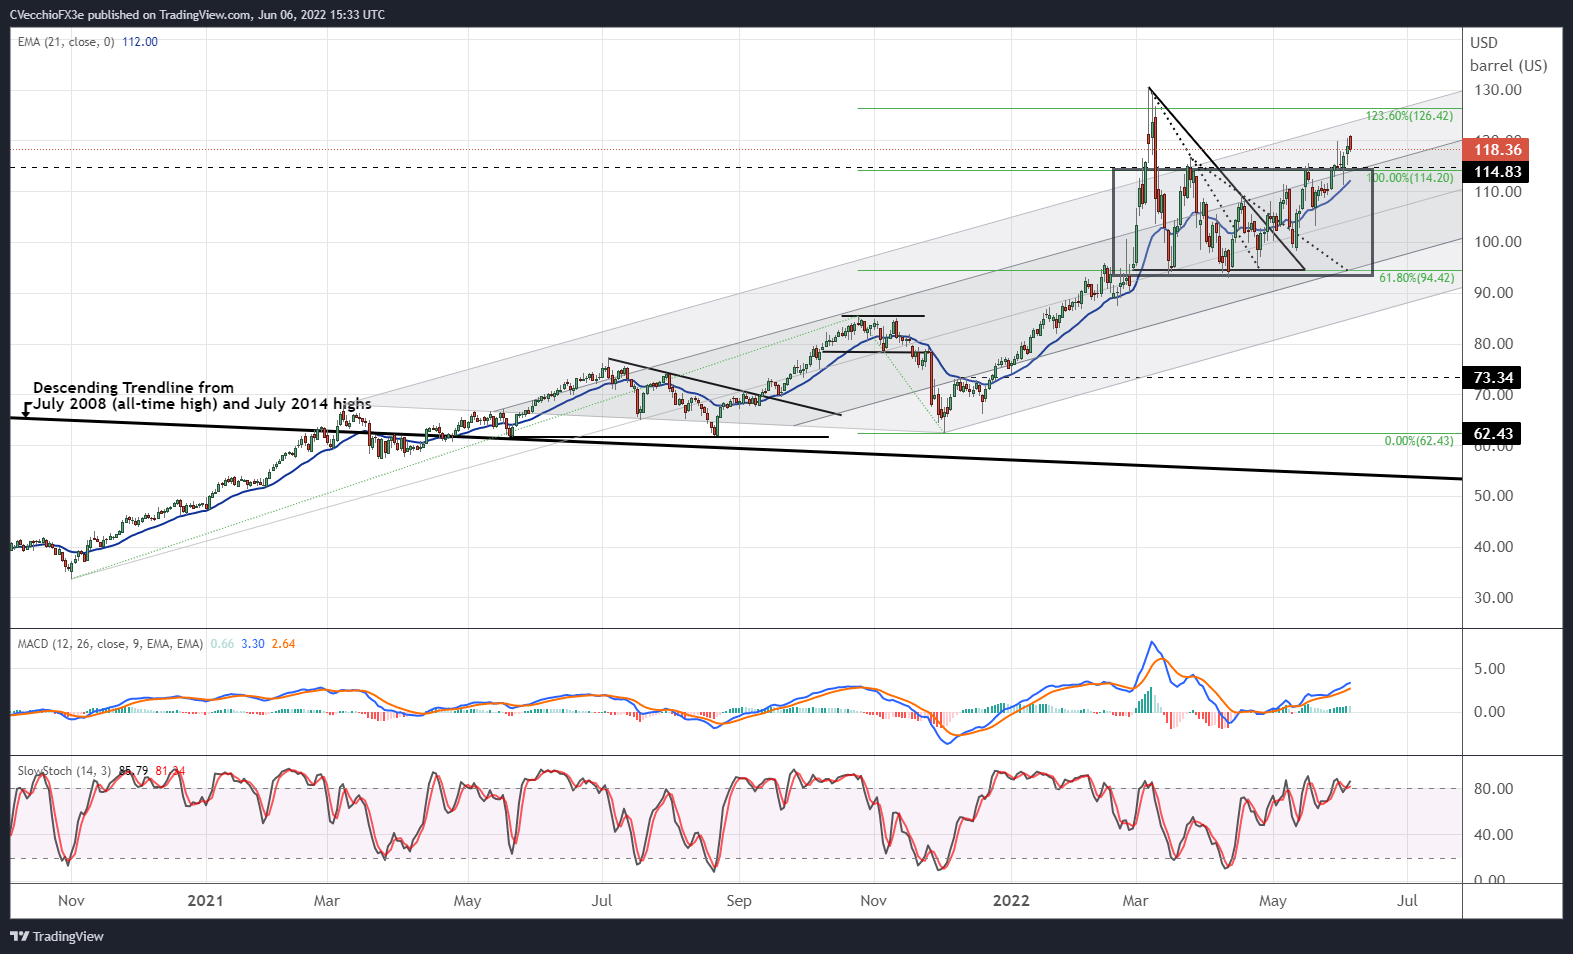
Crude oil prices have traded out of their recent two month-plus range, moving above the 100% Fibonacci extension level (114.20) measured from the November 2020 low, October 2021 high, and December 2021. Bullish momentum has accelerated, with crude oil prices above their daily 5-, 8-, 13-EMAs, and the EMA envelope is in bullish sequential order. The EMA envelope is no longer in bullish sequential order. Daily MACD continues to trend higher above its signal line, while daily Slow Stochastics are holding in overbought territory. As long as crude oil prices remain elevated above 114.20, price action remains constructive towards the 123.6% Fibonacci extension at 126.42.
Crude Oil Price Technical Analysis: Weekly Chart (March 2008 to June 2022) (Chart 3)

On the weekly timeframe, bullish momentum is likewise accelerating. Crude oil prices are back above their weekly 4-, 8-, and 13-EMA, and the EMA envelope remains in bullish sequential order. Weekly MACD is trending higher above its signal line again, and weekly Slow Stochastics are moving towards overbought territory. A bullish bias remains appropriate for crude oil prices for the foreseeable future.

IG CLIENT SENTIMENT INDEX: CRUDE OIL PRICE FORECAST (June 6, 2022) (CHART 4)
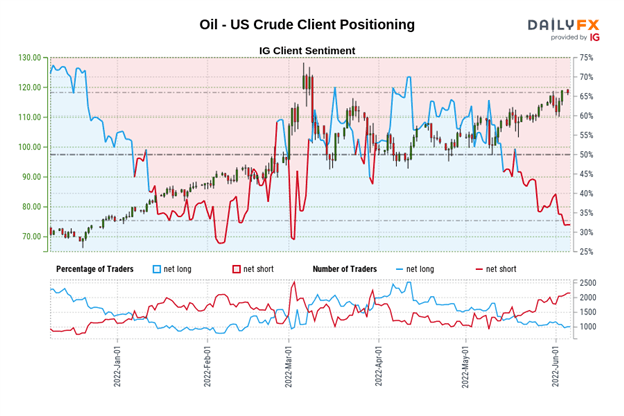
Oil - US Crude: Retail trader data shows 33.06% of traders are net-long with the ratio of traders short to long at 2.02 to 1. The number of traders net-long is 9.42% higher than yesterday and 4.42% lower from last week, while the number of traders net-short is 3.48% higher than yesterday and 14.04% higher from last week.
We typically take a contrarian view to crowd sentiment, and the fact traders are net-short suggests Oil - US Crude prices may continue to rise.
Positioning is less net-short than yesterday but more net-short from last week. The combination of current sentiment and recent changes gives us a further mixed Oil - US Crude trading bias.
Trade Smarter - Sign up for the DailyFX Newsletter
Receive timely and compelling market commentary from the DailyFX team
--- Written by Christopher Vecchio, CFA, Senior Strategist


