


Crude Oil Outlook:
- Crude oil prices have swung higher after testing former triangle resistance-turned-support, but remain within the wide range carved out over the past two months.
- There’s little reason to think that continued volatility within the recent range will die down, unless the Russian invasion of Ukraine ends.
- According to the IG Client Sentiment Index, crude oil prices have a bearish bias in the near-term.
Trade Smarter - Sign up for the DailyFX Newsletter
Receive timely and compelling market commentary from the DailyFX team
Headlines Move the Markets
Energy markets are getting bid once again as reports have emerged that the European Union is inching closer to a deal to ban Russian oil imports. The prospect of constrained supply at a time when OPEC+ is falling short of production estimates is helping provide a boost for oil prices, which are recovering from the bottom side of their two month trading range. For the most part, traders should anticipate continued volatility within the recent two month range; the multiple percentage point moves within the range effectively means that crude oil prices are moving fast, but going nowhere.

Oil Volatility, Oil Price Correlation Weakens
Crude oil prices have a relationship with volatility like most other asset classes, especially those that have real economic uses – other energy assets, soft and hard metals, for example. Similar to how bonds and stocks don’t like increased volatility – signaling greater uncertainty around cash flows, dividends, coupon payments, etc. – crude oil tends to suffer during periods of higher volatility. Crude oil volatility holding steady at historically elevated levels has led to a disconnect in the correlation with oil prices.
OVX (Oil Volatility) Technical Analysis: Daily Price Chart (April 2021 to April 2022) (Chart 1)

Oil volatility (as measured by the Cboe’s gold volatility ETF, OVX, which tracks the 1-month implied volatility of oil as derived from the USO option chain) was trading at 52.41 at the time this report was written, holding steady for most of April. The 5-day correlation between OVX and crude oil prices is -0.20 while the 20-day correlation is -0.45. One week ago, on April 21, the 5-day correlation was +0.34 and the 20-day correlation was +0.60.

Crude Oil Price Technical Analysis: Daily Chart (October 2020 to April 2022) (Chart 2)

A few notes on the daily timeframe. First, but for a few days in early-March, crude oil prices have largely remained between the 61.8% and 100% Fibonacci extension levels (94.42 to 114.20) measured from the November 2020 low, October 2021 high, and December 2021. Second, multiple triangles may be in play, all of which share the same support around the aforementioned 61.8% Fibonacci extension.
Among these triangles, the first (resistance drawn from the early- and mid-March swing highs) proved support after a failed bullish breakout. The second (resistance drawn from the early-March and April highs) appears to be experiencing a bullish breakout today. The third (drawn from the mid-March and April highs) is thus far containing crude oil prices, capping a more significant move higher.
The fact of the matter is that crude oil prices are gaining bullish momentum. Crude oil prices below their daily 5-, 8-, 13-, and 21-EMA envelope (which is not yet in bullish sequential order). Daily MACD is on the cusp of moving above its signal line, while daily Slow Stochastics have turned higher above their median line, on approach to overbought territory. A move back towards range resistance near 114.20 (100% Fibonacci extension of the aforementioned measurement) is possible in the near-term.
Crude Oil Price Technical Analysis: Weekly Chart (March 2008 to April 2022) (Chart 3)
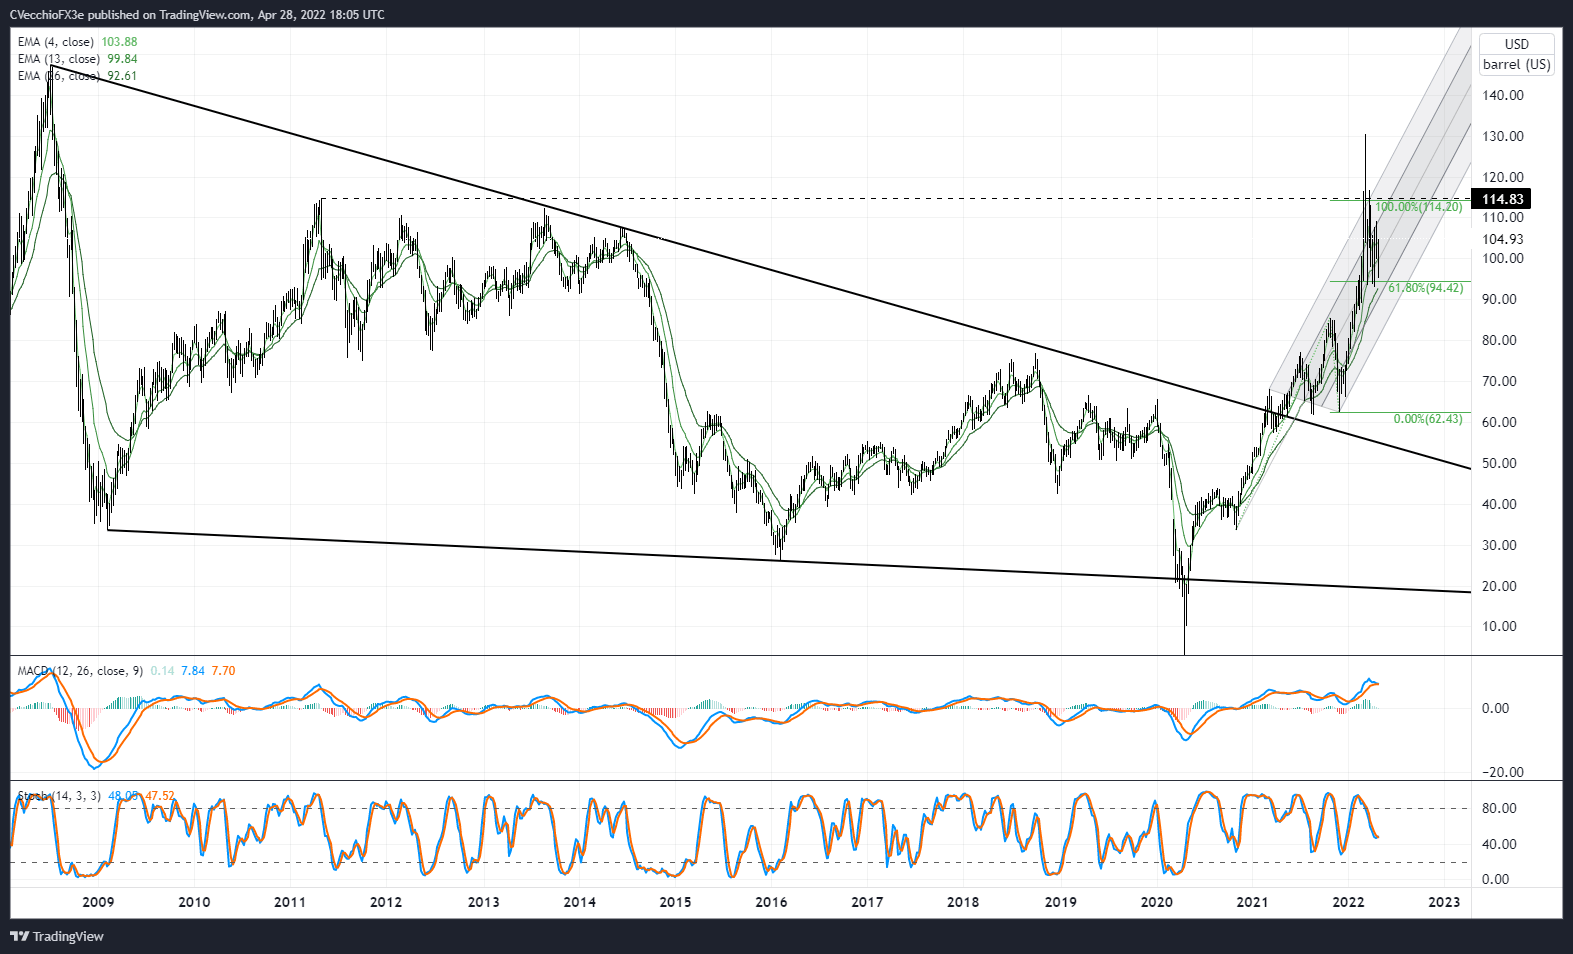
Nothing has changed over the past week. “On the weekly timeframe, it remains clear that that bullish momentum has stalled. While crude oil prices are back above their weekly 4-, 8-, and 13-EMAs, weekly MACD is on the cusp of issuing a sell signal (albeit above its signal line) and weekly Slow Stochastics are continuing to trend lower towards their median line. It still remains preferred to ‘focus on lower-term timeframes (4-hour, daily)…for the foreseeable future.’”
IG CLIENT SENTIMENT INDEX: CRUDE OIL PRICE FORECAST (April 28, 2022) (CHART 4)
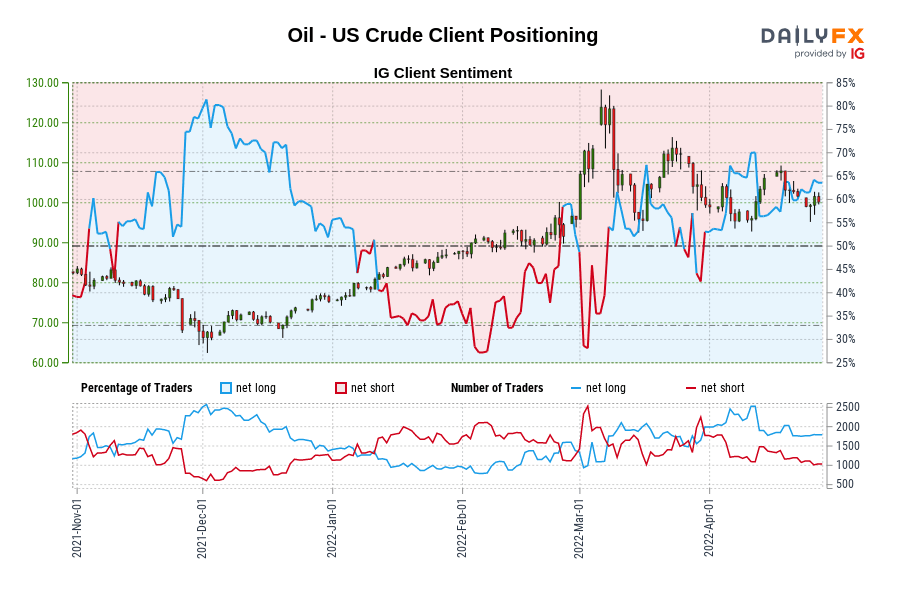
Oil - US Crude: Retail trader data shows 62.96% of traders are net-long with the ratio of traders long to short at 1.70 to 1. The number of traders net-long is 0.56% lower than yesterday and 5.54% lower from last week, while the number of traders net-short is 4.10% lower than yesterday and 12.10% lower from last week.
We typically take a contrarian view to crowd sentiment, and the fact traders are net-long suggests Oil - US Crude prices may continue to fall.
Traders are further net-long than yesterday and last week, and the combination of current sentiment and recent changes gives us a stronger Oil - US Crude-bearish contrarian trading bias.

--- Written by Christopher Vecchio, CFA, Senior Strategist


