


Crude Oil Outlook:
- Crude oil prices continue to experience volatile two-way price action, although a breakout lower from a recent symmetrical triangle appears in progress.
- Increasing US oil production coupled with lower US demand is alleviating upside pressure on energy prices.
- According to the IG Client Sentiment Index, crude oil prices have a bearish bias in the near-term.
Trade Smarter - Sign up for the DailyFX Newsletter
Receive timely and compelling market commentary from the DailyFX team
Supply-Demand Tension Eases
Crude oil prices are trading lower on the day as near-term supply-demand imbalances appear to be easing. Markets are focusing on the subtle yet important shifts in the United States, where, according to the EIA’s weekly report, crude oil production has increased while demand has started to cool off.
According to the EIA, “US crude oil refinery inputs averaged 15.9 million barrels per day during the week ending April 1, 2022 which was 35,000 barrels per day more than the previous week’s average.” On the demand side, oil inventories grew by +2.421 million barrels against an expected drawdown of -2.056 million barrels.
While the European Union failed to ban Russian coal and oil imports, citing a technical error, it appears that another attempt will be made to do so tomorrow. This could introduce more two-way volatility into energy markets, casting into doubt the validity of any technical developments on the charts. Until then, however, with markets focused on data from the US, a bearish breakout is starting to gather pace from the recent symmetrical triangle in crude oil prices.

Oil Volatility, Oil Price Correlation Deteriorating
Crude oil prices have a relationship with volatility like most other asset classes, especially those that have real economic uses – other energy assets, soft and hard metals, for example. Similar to how bonds and stocks don’t like increased volatility – signaling greater uncertainty around cash flows, dividends, coupon payments, etc. – crude oil tends to suffer during periods of higher volatility. The sharp drop in oil volatility over the past two weeks has not been met with a corresponding slump in oil prices, even if oil prices have come down back below $100/brl.
OVX (Oil Volatility) Technical Analysis: Daily Price Chart (April 2021 to April 2022) (Chart 1)
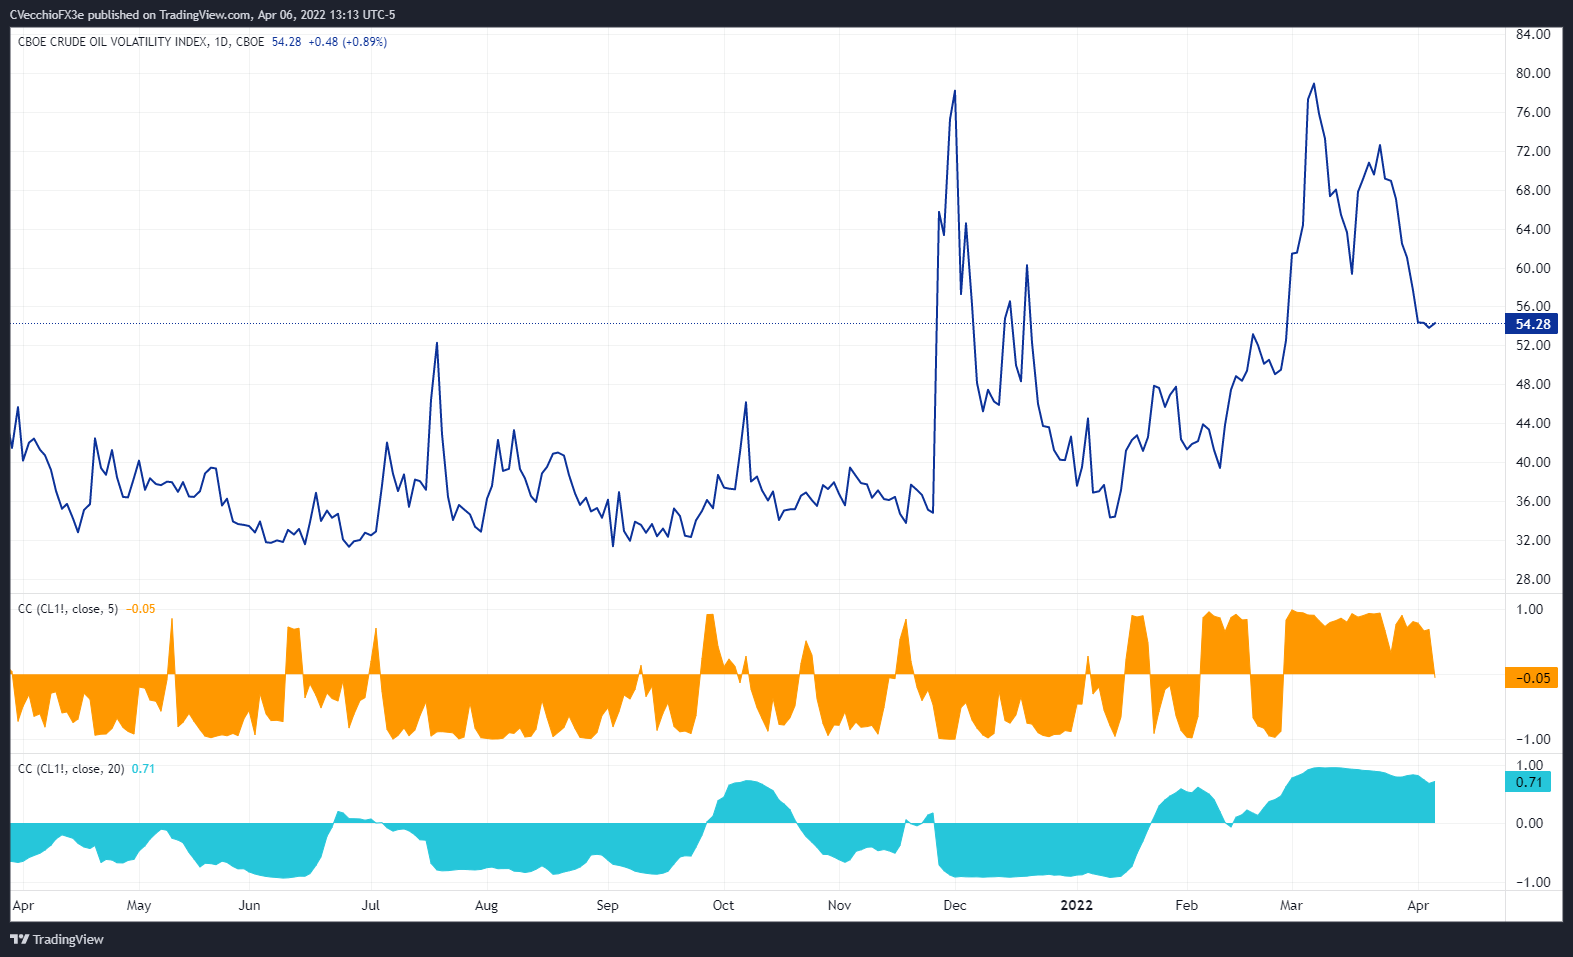
Oil volatility (as measured by the Cboe’s gold volatility ETF, OVX, which tracks the 1-month implied volatility of oil as derived from the USO option chain) was trading at 53.92 at the time this report was written, the lowest reading since late-February. The 5-day correlation between OVX and crude oil prices is -0.07 while the 20-day correlation is +0.70. One week ago, on March 30, the 5-day correlation was +0.71 and the 20-day correlation was +0.81.

Crude Oil Price Technical Analysis: Daily Chart (October 2020 to April 2022) (Chart 2)
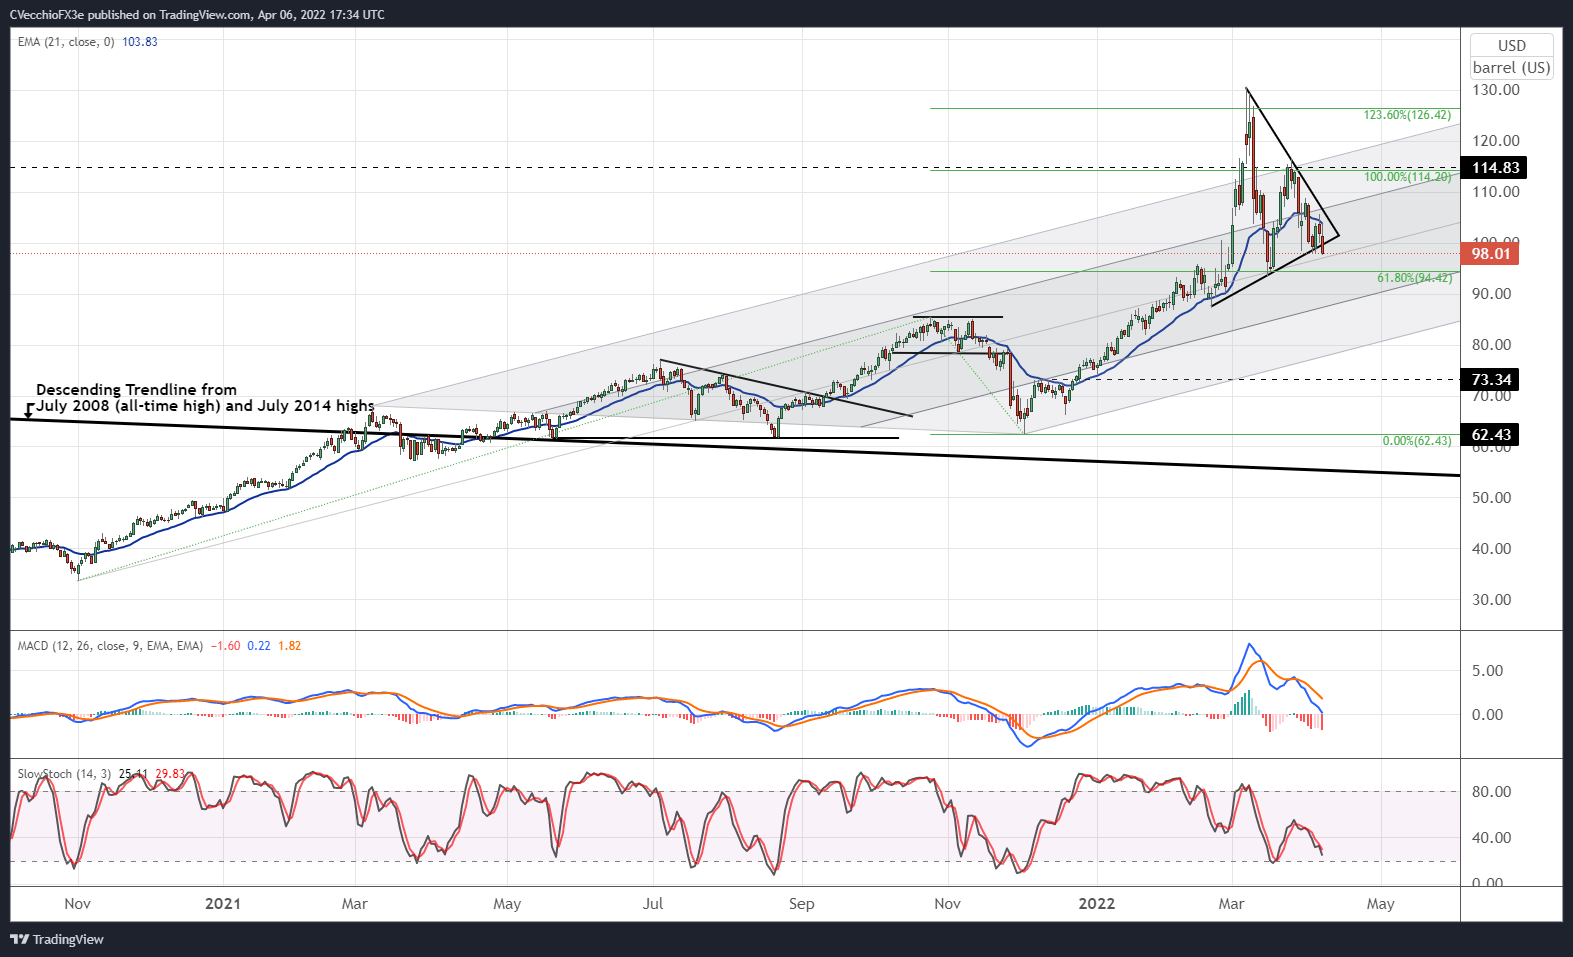
Last week it was noted, that “crude oil prices are beginning to consolidate into a symmetrical triangle, which in context of the preceding move higher, would call for a bullish breakout. But in this environment, dominated by spontaneous headlines on the news wire, it may be best of consider the symmetrical triangle a neutral pattern that could yield a breakout in either direction. The apex of the triangle will be reached by the second week of April, meaning a breakout back to the March high above 130 or back to the late-February low (base of the triangle) should occur sometime soon.”
Consistent with this view, a bearish breakout may be getting started. Crude oil prices are trading below triangle support, and bearish momentum is gathering pace with prices below their daily 5-, 8-, 13-, and 21-EMA envelope, which is in bearish sequential order. Daily MACD is on the verge of dropping below its signal line, while daily Slow Stochastics are on the cusp of entering oversold territory. Targets lower include the March 15 low (93.53) and the February 18 low (87.46).
Crude Oil Price Technical Analysis: Weekly Chart (March 2008 to April 2022) (Chart 3)

On the weekly timeframe, there is more evidence that momentum has stalled. Crude oil prices are now below their weekly 4- and 8-EMAs, even as the weekly 4-, 8-, and 13-EMA envelope remains in bullish sequential order. Weekly MACD is on the cusp of issuing a sell signal (albeit above its signal line), while weekly Slow Stochastics are continuing to trend lower towards their median line. It remains the case that “if the aforementioned symmetrical triangle yields a breakout, it will likely be in a quick, violent manner that won’t necessarily be reflected on the weekly timeframe until after the fact; focusing on lower-term timeframes (4-hour, daily) seems appropriate for the foreseeable future.”
IG CLIENT SENTIMENT INDEX: CRUDE OIL PRICE FORECAST (April 6, 2022) (CHART 4)

Oil - US Crude: Retail trader data shows 55.76% of traders are net-long with the ratio of traders long to short at 1.26 to 1. The number of traders net-long is 2.28% lower than yesterday and 23.02% higher from last week, while the number of traders net-short is 13.72% lower than yesterday and 25.79% lower from last week.
We typically take a contrarian view to crowd sentiment, and the fact traders are net-long suggests Oil - US Crude prices may continue to fall.
Traders are further net-long than yesterday and last week, and the combination of current sentiment and recent changes gives us a stronger Oil - US Crude-bearish contrarian trading bias.

--- Written by Christopher Vecchio, CFA, Senior Strategist


