


Crude Oil Outlook:
- Crude oil prices have once again surged higher as the EU weighs banning oil imports from Russia.
- Resistance from mid- and late-February, around 95, has proved itself as support in recent days.
- According to the IG Client Sentiment Index, crude oil prices have a mixed bias in the near-term.
Trade Smarter - Sign up for the DailyFX Newsletter
Receive timely and compelling market commentary from the DailyFX team
Oil Explodes Higher, Again
After losing nearly -30% from the early-March highs, crude oil prices stabilized in recent days and have once again found reason to push to the topside. While the Russian invasion of Ukraine has seemingly hit a point of attrition, Russia’s refusal to withdraw its troops has provoked the European Union into escalating sanctions once more. The news that the EU may soon ban Russian oil imports comes after the United States did so last week, threatening a further disruption of global energy supplies. Crude oil’s three-day rally of over +16% underscores the volatile environment likely to persist.

Oil Volatility, Oil Price Correlation Tightens
Crude oil prices have a relationship with volatility like most other asset classes, especially those that have real economic uses – other energy assets, soft and hard metals, for example. Similar to how bonds and stocks don’t like increased volatility – signaling greater uncertainty around cash flows, dividends, coupon payments, etc. – crude oil tends to suffer during periods of higher volatility. Sustained heightened geopolitical tensions continue to translate into higher oil volatility, allowing for oil prices to move higher in an atypical manner that will continue for the foreseeable future.
OVX (Oil Volatility) Technical Analysis: Daily Price Chart (March 2021 to March 2022) (Chart 1)

Oil volatility (as measured by the Cboe’s gold volatility ETF, OVX, which tracks the 1-month implied volatility of oil as derived from the USO option chain) was trading at 70.74 at the time this report was written. The surge in oil volatility – driven by uncertainty around near-term energy supplies – has coincided with higher oil prices. The 5-day correlation between OVX and crude oil prices is +0.92 while the 20-day correlation is +0.90. One week ago, on March 14, the 5-day correlation was +0.86 and the 20-day correlation was +0.94.

Crude Oil Price Technical Analysis: Daily Chart (October 2020 to March 2022) (Chart 2)

Crude oil prices are finding follow through higher after the morning star candlestick pattern marked support at a familiar area around 95, where the mid- and late-February highs carved out resistance. A move back up to the 100% Fibonacci extension of the November 2020 low, October 2021 high, December 2021 low move is likely (114.20), and beyond towards the 123.6% Fibonacci extension (126.42); the yearly high comes in a bit higher, at 130.50. If the EU bans oil imports from Russia, a move back to the highs seems preordained; while refutation of such a development could easily see crude oil prices slump back towards 95 over the course of a few days.
Crude Oil Price Technical Analysis: Weekly Chart (January 2008 to March 2022) (Chart 3)
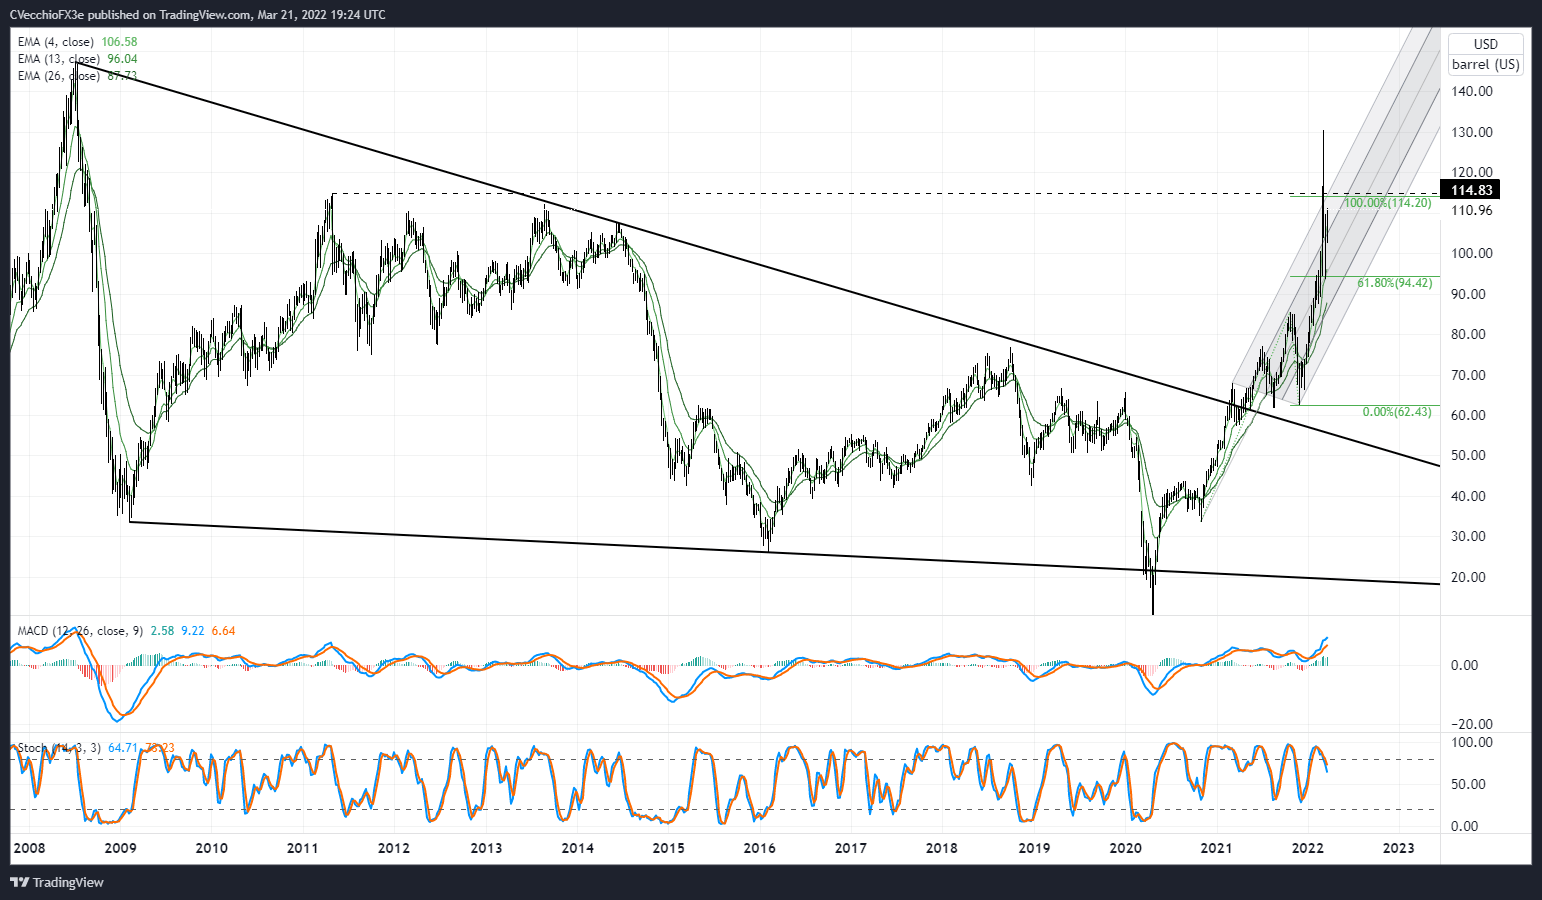
Crude oil prices had previously breached the May 2011 high established at 114.83, closing above said level in the first week of March. But gains proved fleeting, with the May 2011 high, pitchfork resistance, and the 100% Fibonacci extension serving as a formidable confluence of resistance. With a mostly bullish momentum backdrop – crude oil prices are above their weekly 4-, 8-, and 13-EMA envelope, weekly MACD trending higher, and weekly Slow Stochastics just out of overbought territory – it remains the case that “‘buy the dip’ remains the preferred approach.”
IG CLIENT SENTIMENT INDEX: CRUDE OIL PRICE FORECAST (March 21, 2022) (CHART 4)
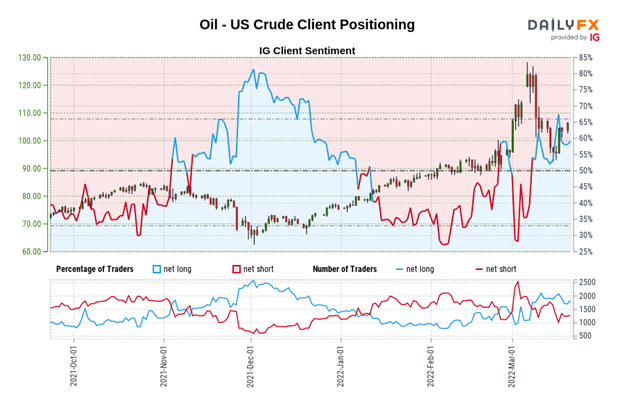
Oil - US Crude: Retail trader data shows 57.24% of traders are net-long with the ratio of traders long to short at 1.34 to 1. The number of traders net-long is 11.85% higher than yesterday and 4.10% lower from last week, while the number of traders net-short is 15.20% higher than yesterday and 17.09% lower from last week.
We typically take a contrarian view to crowd sentiment, and the fact traders are net-long suggests Oil - US Crude prices may continue to fall.
Positioning is less net-long than yesterday but more net-long from last week. The combination of current sentiment and recent changes gives us a further mixed Oil - US Crude trading bias.

--- Written by Christopher Vecchio, CFA, Senior Strategist


