


Crude Oil Outlook:
- Crude oil prices took a dive earlier this week, but price action suggests that the bearish impulse is in the rearview mirror.
- The OPEC+ announcement seems to have been digested by markets, which are refocusing on the reality of the supply-demand imbalance likely to persist.
- According to the IG Client Sentiment Index, crude oil prices have a bullish bias in the near-term.

Bears Be Warned
While US equity markets have been climbing their own wall of worry, so too have crude oil prices: the delta variant; the OPEC+ announcement to increase supply; and the surprise climb in US oil inventories.
With respect to the three points above, you can read more about the delta variant and its implication for financial markets here.
In terms of OPEC+ increasing oil production output, the announcement of an increase of +400K barrels per day from August through December proved to be less than anticipated, which according to rumors in mid-July, would amount to +600K bpd. It remains the base case scenario that the persistent supply-demand imbalance that has defined energy markets throughout 2021 will continue.
In terms of the US oil inventory data, the surprise rise of +2.1M barrels masked the otherwise ‘bullish’ aspect of the report. US oil imports surged while exports fell during the previous week – an unexpected development – but gasoline (-121K) and distillate (-1.3M) inventories dropped, suggesting strong underlying demand.
Where do these factors leave crude oil prices? Following crude oil prices’ dive earlier this week, price action now suggests that the bearish impulse is in the rearview mirror.
Relationship Between Oil Volatility and Oil Prices Strong
Crude oil prices have a relationship with volatility like most other asset classes, especially those that have real economic uses – other energy assets, soft and hard metals, for example. Similar to how bonds and stocks don’t like increased volatility – signaling greater uncertainty around cash flows, dividends, coupon payments, etc. – crude oil tends to suffer during periods of higher volatility. On the other hand, a plunge in crude oil volatility tends to support price appreciation.
OVX (Oil Volatility) Technical Analysis: Daily Price Chart (July 2020 to July 2021) (Chart 1)
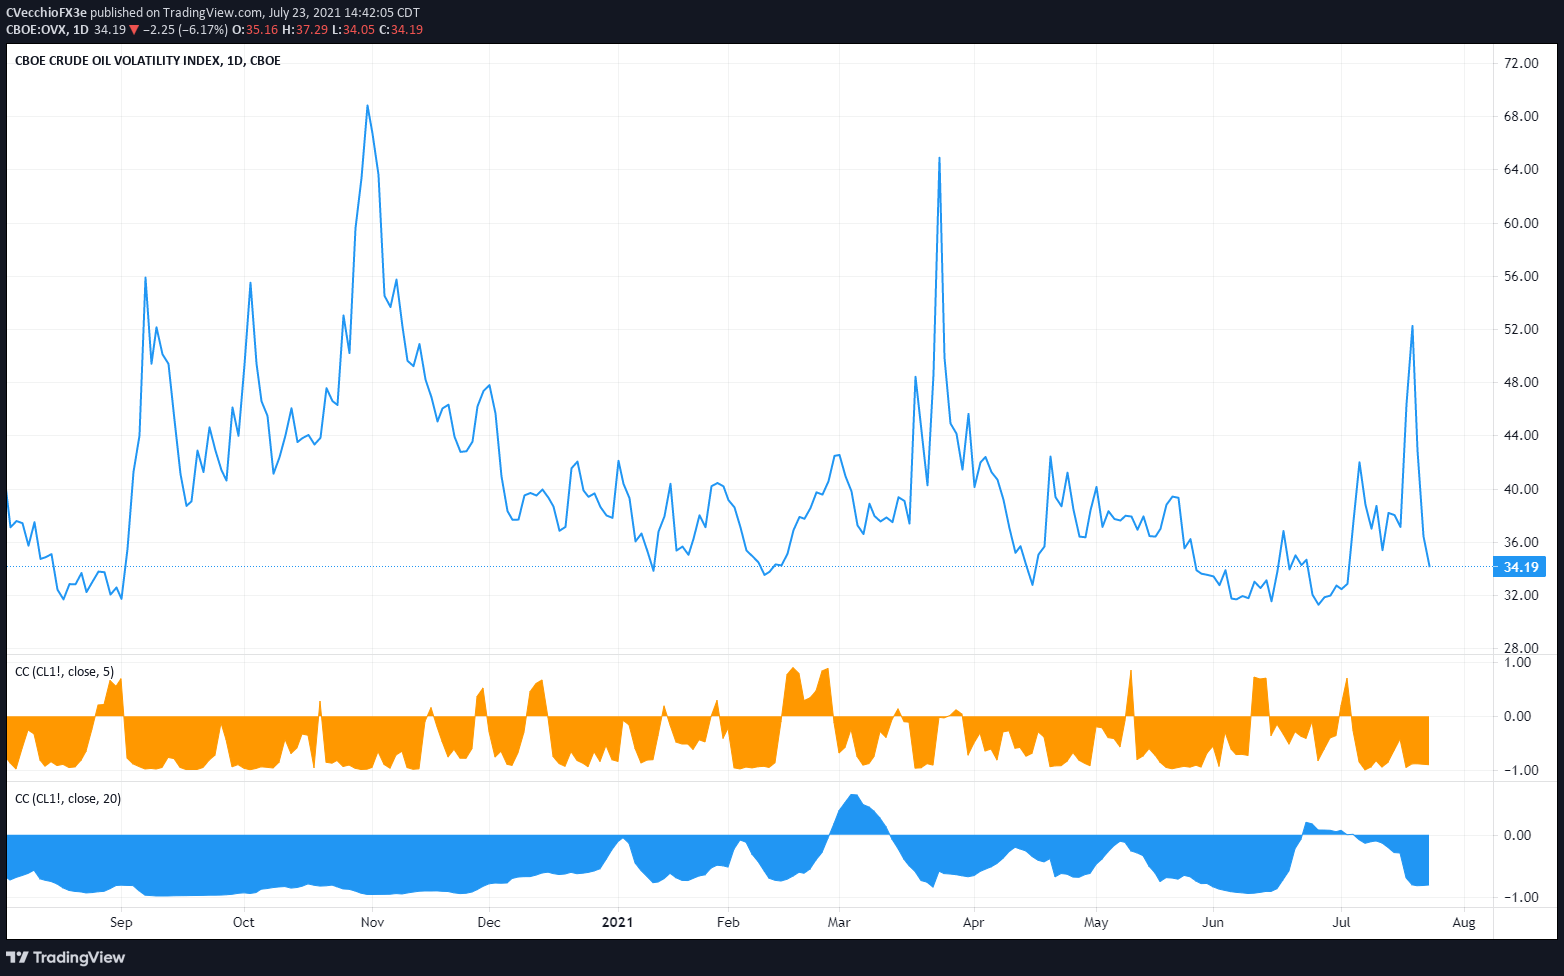
Oil volatility (as measured by the Cboe’s gold volatility ETF, OVX, which tracks the 1-month implied volatility of oil as derived from the USO option chain) was trading at 34.19 at the time this report was written – a sharp decline from the high on Monday at 71.52, which was the highest volatility reading seen since June 16, 2020.
Now, oil volatility is back levels experienced going back to 2019, and moreover, the relationship between crude oil and volatility has strengthened. The 5-day correlation between OVX and crude oil prices is -0.90 while the 20-day correlation is -0.81; and one week ago, on July 16, the 5-day correlation was -0.64 and the 20-day correlation was -0.29.

Crude Oil Price Technical Analysis: Daily Chart (July 2020 to July 2021) (Chart 2)
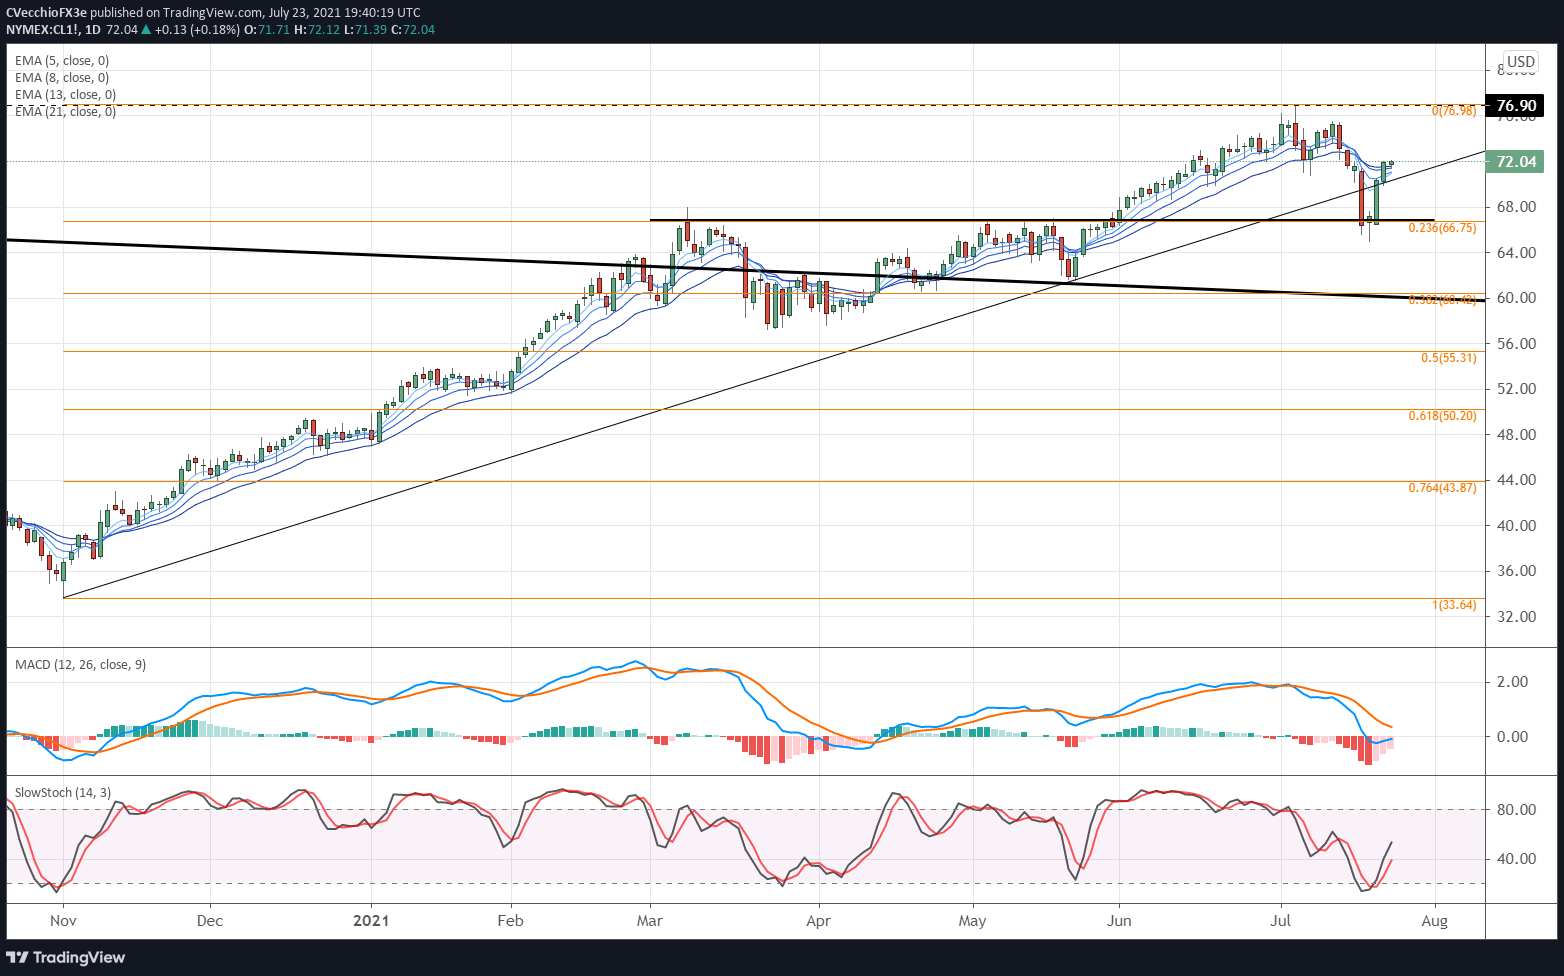
In the crude oil price forecast last week it was suggested that “an evening star candle cluster at the start of the month has capped price action; a three-candlestick topping pattern is proving valid…with the daily 8-EMA recently breached on a closing basis for the first time since May 21, there is tangible evidence to believe that near-term bullish momentum has been sapped. But it may not be a significant correction in price that occurs; instead, it may be consolidation as time passes.”
Crude oil prices declined sharply thereafter, but the losses didn’t persist. After the above comment was written on July 14, crude oil prices closed last week at 71.56. At the time this report was written, crude oil prices were trading at 72.04. In the interim, they dropped as low as 65.01. That’s a lot of volatility with nothing to show for it; time has passed, weak hands have been washed out – but prices are basically unchanged.
Now that the uptrend from the November 2020 and May 2021 swing lows has been retaken, the technical posture is once again bullish. In fact, price action earlier this week appears to have been nothing more than a bear trap, having establish a bullish morning star candlestick cluster at the 23.6% Fibonacci retracement of the November 2020 low/July 2021 high range.
Crude Oil Price Technical Analysis: Weekly Chart (January 2008 to July 2021) (Chart 3)
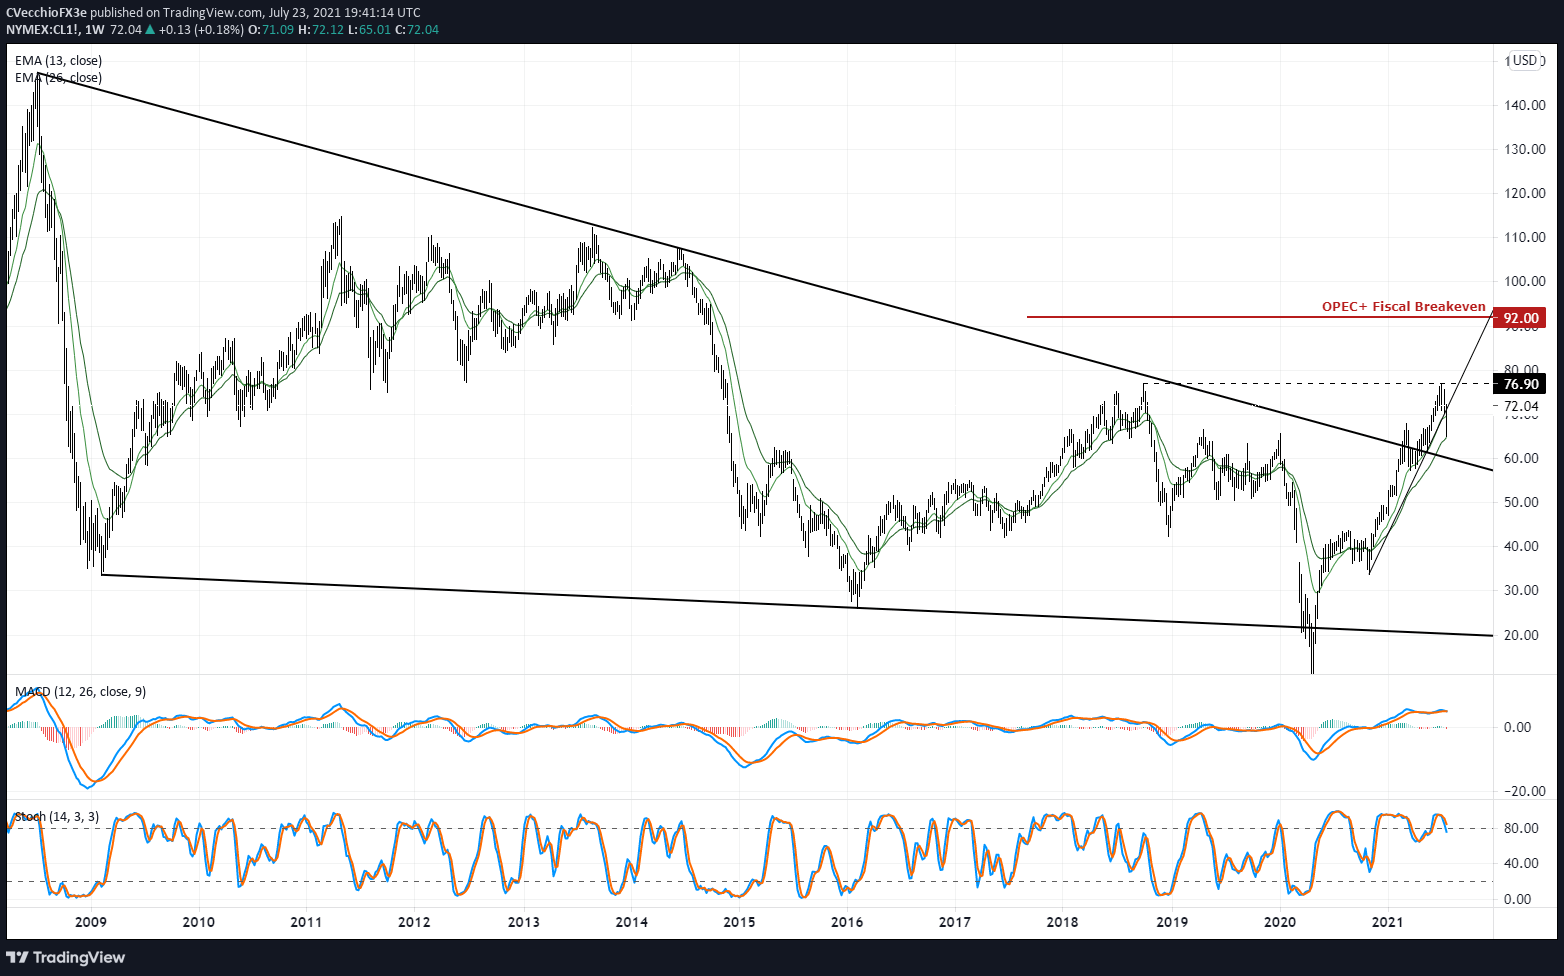
Last week on July 14 it was noted that “sideways chop towards the weekly 13-EMA (one quarter moving average) is possible; weekly 13-EMA lines up directly with the rising trendline dating back to the November 2020 low.” The weekly 13-EMA (one-quarter average) was reached, and crude oil prices fell as far as the weekly 26-EMA (half-year average) before rebounding. But now that a weekly close above the weekly 13-EMA is being established, price action has coalesced into a bullish hammer. A rally back towards the 2018 high (76.90) and the July high (76.98) appears to be on deck.
IG CLIENT SENTIMENT INDEX: CRUDE OIL PRICE FORECAST (July 23, 2021) (CHART 4)

Oil - US Crude: Retail trader data shows 47.52% of traders are net-long with the ratio of traders short to long at 1.10 to 1. The number of traders net-long is 0.41% lower than yesterday and 18.76% lower from last week, while the number of traders net-short is 1.98% lower than yesterday and 5.59% lower from last week.
We typically take a contrarian view to crowd sentiment, and the fact traders are net-short suggests Oil - US Crude prices may continue to rise.
Positioning is less net-short than yesterday but more net-short from last week. The combination of current sentiment and recent changes gives us a further mixed Oil - US Crude trading bias.

--- Written by Christopher Vecchio, CFA, Senior Currency Strategist


