


Crude Oil Outlook:
- Delayed oil inventory data from the US and news from OPEC+ that the UAE will be allowed to increase its production are making for volatile energy markets.
- Despite choppy price action, the latest bits of information amount to nothing more than noise; the bullish technical structure remains intact.
- According to the IG Client Sentiment Index, crude oil prices have a mixed bias.
Crude Oil Prices Experience Turbulence
Delayed oil inventory data from the US and news from OPEC+ that the UAE will be allowed to increase its production are making for volatile energy markets mid-week.
With respect to the latter, the incremental increase in oil production (about +600K barrels per day, per reports) is not nearly enough to offset the persistent supply-demand imbalance that has defined energy markets throughout 2021.
In terms of the former, the delayed oil inventory data was eventually released, and showed a draw of -7.9 million barrels, well above the forecast of a decline of -4 million barrels, according to a Bloomberg News survey.
American demand for energy continues to increase at a torrid pace as the US economy reopens; gasoline prices on average have hit their highest level since 2014 (albeit in part to seasonal factors as well; summer is the high season for gasoline demand).
Relationship Between Oil Volatility and Oil Prices Flips
Crude oil prices have a relationship with volatility like most other asset classes, especially those that have real economic uses – other energy assets, soft and hard metals, for example. Similar to how bonds and stocks don’t like increased volatility – signaling greater uncertainty around cash flows, dividends, coupon payments, etc. – crude oil tends to suffer during periods of higher volatility.
Heightened uncertainty in financial markets due to increasing macroeconomic tensions decreases theoretical demand for energy; signs that the global economy is recovering from the coronavirus pandemic reduces uncertainty, and thus, volatility. Questions around OPEC+, however, do not.
OVX (Oil Volatility) Technical Analysis: Daily Price Chart (July 2020 to July 2021) (Chart 1)

Oil volatility (as measured by the Cboe’s gold volatility ETF, OVX, which tracks the 1-month implied volatility of oil as derived from the USO option chain) was trading at 37.03 at the time this report was written. Oil volatility continues to persist around levels experienced going back to 2019 and there is evidence that the relationship between crude oil and volatility is normalizing. The 5-day correlation between OVX and crude oil prices is -0.67 while the 20-day correlation is -0.21; and one week ago, on July 7, the 5-day correlation was -0.84 and the 20-day correlation was -0.08.

Crude Oil Price Technical Analysis: Daily Chart (July 2020 to July 2021) (Chart 2)
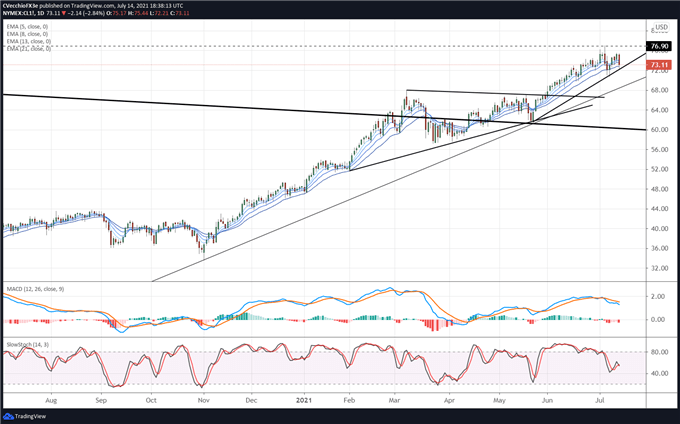
In the crude oil price forecast at the end of June it was noted that “in the context of the uptrend from the April 2020, November 2020, and May 2021 swing lows intact, the technical posture remains bullish.” Since then, crude oil prices established a fresh yearly high, breaching the 2018 high at 76.90 in the process. But not all is sanguine. An evening star candle cluster at the start of the month has capped price action; a three-candlestick topping pattern is proving valid.
With the daily 8-EMA recently breached on a closing basis for the first time since May 21, there is tangible evidence to believe that near-term bullish momentum has been sapped. But it may not be a significant correction in price that occurs; instead, it may be consolidation as time passes. A lack of agreement in the daily EMA envelope as well as daily MACD and daily Slow Stochastics suggests more clarity is needed before a near-term directional bias can be ascertained.
Crude Oil Price Technical Analysis: Weekly Chart (January 2008 to July 2021) (Chart 3)
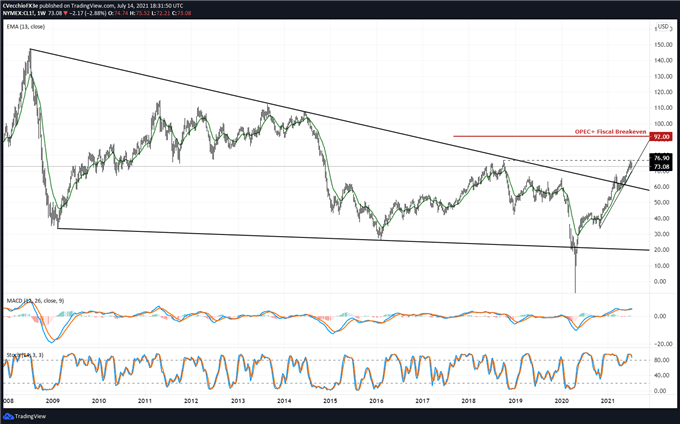
In the prior crude oil price forecast it was noted that “while the 2018 high has not been reached, it stands to reason that a pullback on lower timeframes should be eyed for potential opportunities to enter (or re-enter) the market on the long side. Until the pandemic uptrend breaks, there is no good technical reason to be bearish.” The 2018 high has now been breached. With the November 2020 and May 2021 swing lows intact, the longer-term technical posture remains bullish. Sideways chop towards the weekly 13-EMA (one quarter moving average) is possible; weekly 13-EMA lines up directly with the rising trendline dating back to the November 2020 low.
IG CLIENT SENTIMENT INDEX: CRUDE OIL PRICE FORECAST (July 14, 2021) (CHART 4)
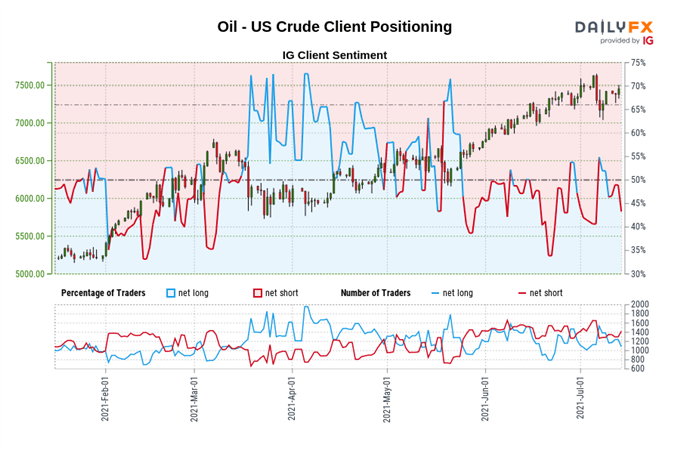
Oil - US Crude: Retail trader data shows 47.52% of traders are net-long with the ratio of traders short to long at 1.10 to 1. The number of traders net-long is 0.41% lower than yesterday and 18.76% lower from last week, while the number of traders net-short is 1.98% lower than yesterday and 5.59% lower from last week.
We typically take a contrarian view to crowd sentiment, and the fact traders are net-short suggests Oil - US Crude prices may continue to rise.
Positioning is less net-short than yesterday but more net-short from last week. The combination of current sentiment and recent changes gives us a further mixed Oil - US Crude trading bias.

--- Written by Christopher Vecchio, CFA, Senior Currency Strategist


