


Crude Oil Outlook:
- Crude oil prices have broken the downtrend dating back to the all-time high, buoyed by growth optimism and inflation concerns.
- News regarding progress towards Iran and the US rejoining the JCPOA coupled with OPEC+ leaving their production cuts in place are the dominant fundamental factors at present time.
- According to the IG Client Sentiment Index, crude oil prices may struggle in the immediate near-term.
Crude Oil Prices Step on the Gas
Crude oil prices have started to experience greater topside traction in recent days, breaking out from the symmetrical triangle consolidation while sustaining an earlier bullish move above the descending trendline from the July 2008 (all-time high) and June 2014 highs. The technical structure is bullish, through and through.
The fundamental backdrop has brought clarity in recent days as well. It appears that both Iran and the US are coming close to agreeing to a revised JCPOA, a development largely priced-in as market participants anticipate a significant supply of Iranian oil to join global markets. With global demand increasing at a torrid pace post-pandemic, the OPEC+ announcement that production cuts will remain in place keep the near-term supply-demand imbalance as a viable catalysts for more gains in crude oil prices.
All-in-all, this has been a positive mix of news for crude oil prices. In fact, taking a look at measures of volatility, it seems that the current mix of news has traders feeling less uncertain about the future – typically a positive omen for oil markets.

Relationship Between Oil Volatility and Oil Prices Remains Normal
Crude oil prices have a relationship with volatility like most other asset classes, especially those that have real economic uses – other energy assets, soft and hard metals, for example. Similar to how bonds and stocks don’t like increased volatility – signaling greater uncertainty around cash flows, dividends, coupon payments, etc. – crude oil tends to suffer during periods of higher volatility.
Heightened uncertainty in financial markets due to increasing macroeconomic tensions decreases theoretical demand for energy; signs that the global economy is recovering from the coronavirus pandemic reduces uncertainty, and thus, volatility.
OVX (Oil Volatility) Technical Analysis: Daily Price Chart (June 2020 to June 2021) (Chart 1)
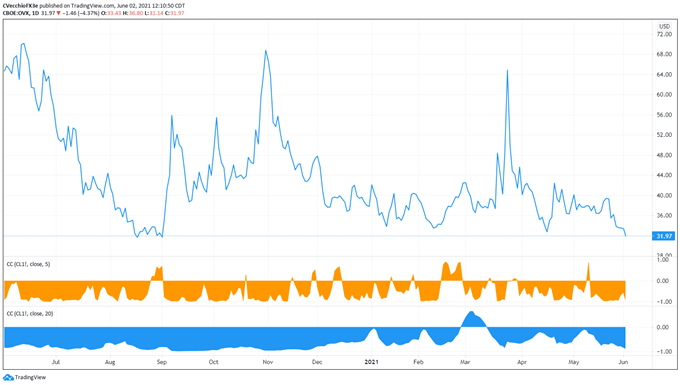
Oil volatility (as measured by the Cboe’s gold volatility ETF, OVX, which tracks the 1-month implied volatility of oil as derived from the USO option chain) was trading at 31.97 at the time this report was written. Oil volatility continues to persist around levels experienced going back to 2019. The futures curve suggests that volatility will remain around current levels for the foreseeable future.
With oil volatility trading sideways, and crude oil prices bobbing around, the correlations we monitor remain ‘normal’ (greater than -0.50). The 5-day correlation between OVX and crude oil prices is -0.92 while the 20-day correlation is -0.87; and one week ago, on May 25, the 5-day correlation was -0.92 and the 20-day correlation was -0.67.

Crude Oil Price Technical Analysis: Daily Chart (June 2020 to June 2021) (Chart 2)
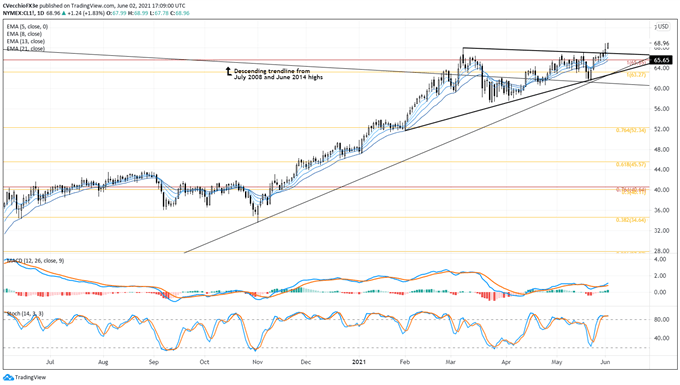
Exactly one week ago it was noted that “it remains the case that there persists the possibility of a bullish breakout.” Crude oil prices have broken out of a symmetrical triangle on the daily timeframe, decisively clearing both the 2020 high (65.65) and the descending trendline from the July 2008 and June 2014 highs. In doing so, crude oil prices have risen to their highest level since October 2018, and more gains may be ahead. Crude oil prices are above their daily 5-, 8-, 13-, and 21-EMA envelope, which is in bullish sequential order. Daily MACD is trending higher above its signal line, while daily Slow Stochastics are holding in overbought territory.
Crude Oil Price Technical Analysis: Weekly Chart (December 2013 to June 2021) (Chart 3)
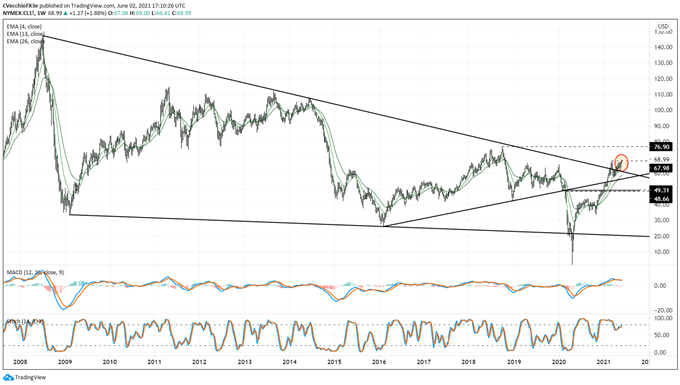
In the prior crude oil price forecast it was noted that “the long weekly wicks speak to strong demand in the market right at the weekly 13-EMA, which is effectively a moving average of the past one quarter of price action…the weekly 13-EMA has held as support through April, and now crude oil prices are once more in make-or-break territory at the multi-year descending trendline from all-time highs. Holding in make-or-break territory, improvements in the technical structure on lower timeframes suggests that a breakout attempt may soon emerge.” The breakout has thus arrived; the rally towards the 2018 high at 76.90 has begun.
IG CLIENT SENTIMENT INDEX: CRUDE OIL PRICE FORECAST (June 2, 2021) (CHART 4)
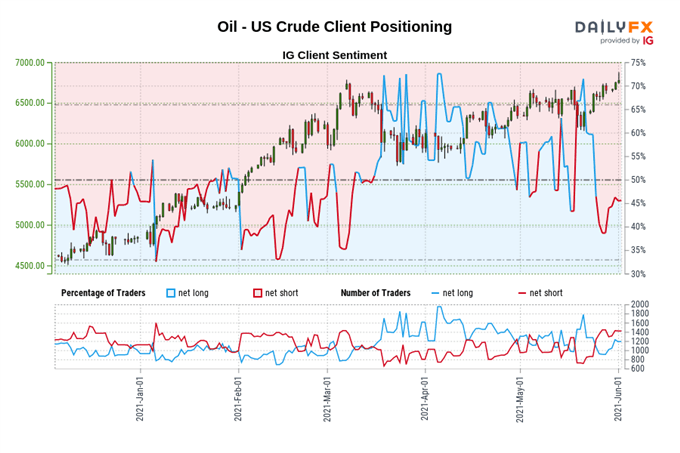
Oil - US Crude: Retail trader data shows 47.34% of traders are net-long with the ratio of traders short to long at 1.11 to 1. The number of traders net-long is 5.96% higher than yesterday and 29.18% higher from last week, while the number of traders net-short is 2.63% lower than yesterday and 4.11% higher from last week.
We typically take a contrarian view to crowd sentiment, and the fact traders are net-short suggests Oil - US Crude prices may continue to rise.
Yet traders are less net-short than yesterday and compared with last week. Recent changes in sentiment warn that the current Oil - US Crude price trend may soon reverse lower despite the fact traders remain net-short.

--- Written by Christopher Vecchio, CFA, Senior Currency Strategist


