


OIL PRICE OUTLOOK: CRUDE OIL CHARTS CATCH SUPPORT AND HINT AT POTENTIAL UPTREND CONTINUATION
- Oil price action could climb from current levels with technical support around the 58.00 handle showing signs of keeping the commodity bolstered
- Crude oil has potential to regain upward momentum as petrol prices begin to bounce back after sliding 10%
- The price of oil may follow the broader trend of risk assets higher as traders rejoice tangible de-escalation in the trade war saga between the US and China with their signed trade agreement
Crude oil prices could be on the cusp of a broader rebound attempt following the commodity’s 10-plus percent slide from its January 08 swing high amid fading fears of geopolitical risk in the Middle East causing an oil supply shock.
Market participants have subsequently shifted their focus away from US-Iran tension, however, considering President Trump steered away from military retaliation in lieu of economic sanctions. Furthermore, the attention of traders remains affixed to more upbeat developments like the recently inked phase one trade deal hammered out by Sino-American negotiators.
Consequently, the price of crude oil is beginning to find buoyancy once again as the commodity catches bid alongside other risk assets in response to the increasing acceptance of the world’s rebounding economic growth narrative, which stands to increase crude oil demand.
Check out our interactive Global Commodities dashboard for insight on worldwide commodity imports and exports over the last decade.
OIL PRICE CHART: DAILY TIME FRAME (SEPTEMBER 2019 TO JANUARY 2020)
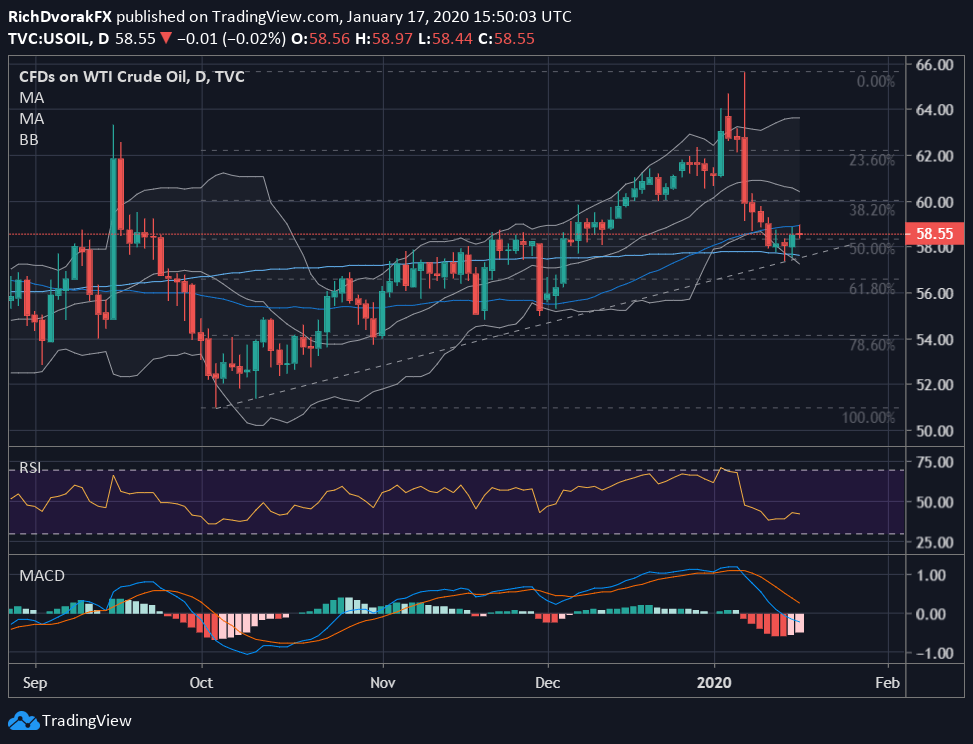
Chart created by @RichDvorakFX with TradingView
Oil is currently fluctuating around the $58.50 price level after ticking nearly 2% higher from the January 15 low around the $57.50 mark. The year-to-date low recorded by crude oil prices closely aligns with bullish trendline support extended through the intraday bottoms on October 03 October 10 lows.
Don’t overlook these Crude Oil Facts that every oil trader should know.
Crude oil prices also could be catching technical support from its 200-day simple moving average and mid-point retracement of its October 2019 to January 2020 trading range, which roughly highlights the area of confluence at the $58.00 handle. On the other hand, crude oil’s 50-day simple moving average has potential to keep a sustained rebound attempt limited.
OIL PRICE CHART: 4-HOUR TIME FRAME (DECEMBER 2019 TO JANUARY 2020)
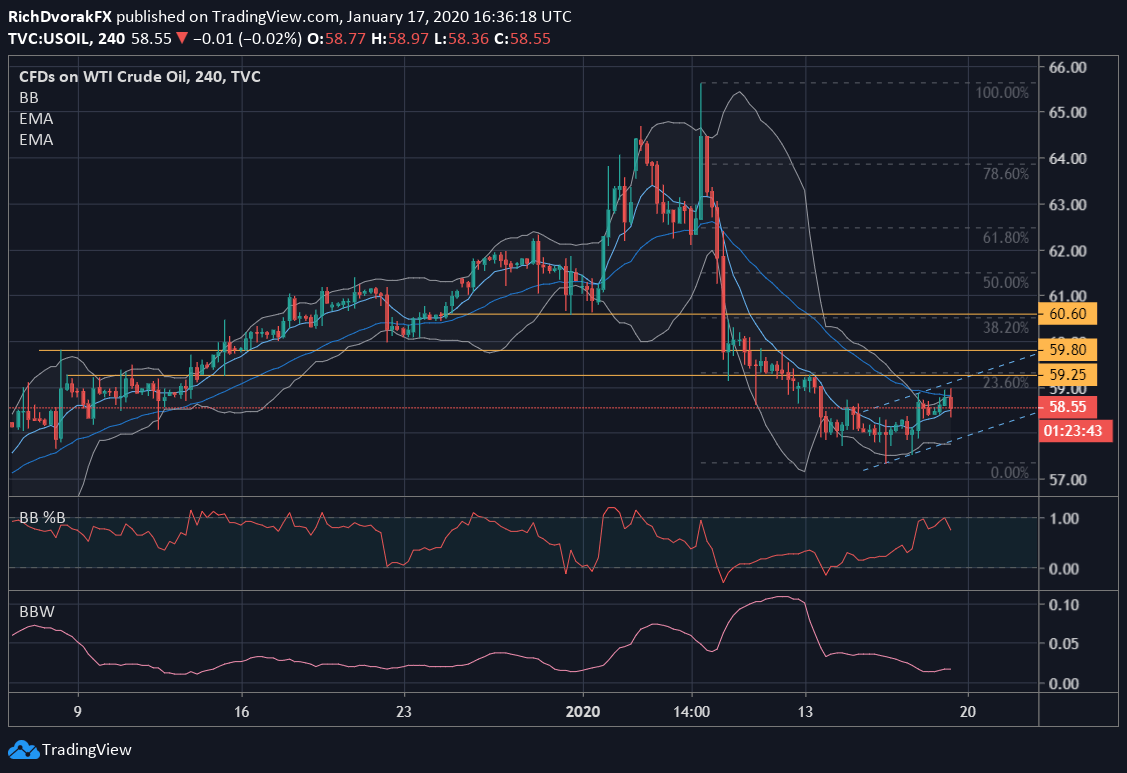
Chart created by @RichDvorakFX with TradingView
Zooming in a bit on a 4-hour crude oil chart reveals a bullish channel potentially under development, which could be constructive for higher oil prices so long as the commodity can form another higher-low above the January 16 close.
Likewise, crude oil prices are now trading above its 9-EMA on this closer time frame and speaks to an impending short-term uptrend. Although, the price of oil faces downward pressure stemming from its 34-EMA.

Another upside obstacle faced by crude oil price bulls is the $59.25 area – roughly aligning with the 23.6% Fibonacci retracement level of its year-to-date trading range. Technical confluence with potential of hindering additional upside in oil is also noted roughly around the $59.80 and $60.60 price levels.
OIL PRICE CHART & VIX INDEX OVERLAY: DAILY TIME FRAME (SEPTEMBER 2018 TO JANUARY 2020)
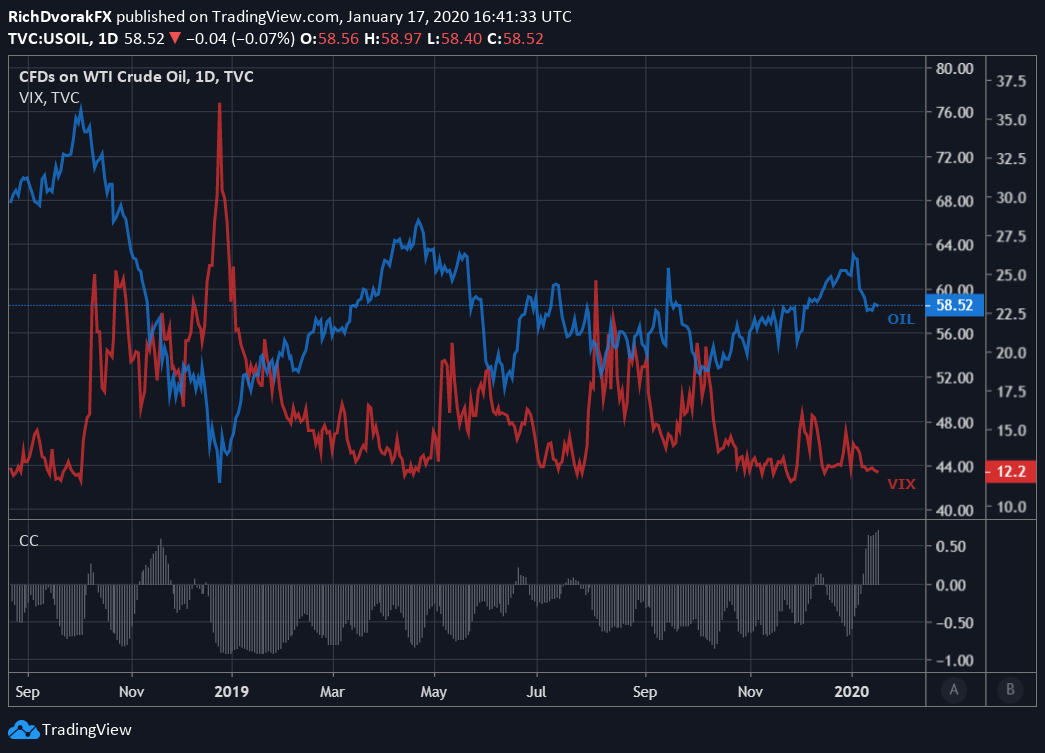
Chart created by @RichDvorakFX with TradingView
Market volatility and perceived uncertainty or risk – frequently quantified using the VIX Index – has swooned as of late with the probability of a recession owing to improving US-China trade relations and wave of accommodative monetary policy from global central banks.

That said, there is generally an inverse relationship between volatility and risk assets such as oil. While the rolling 20-day correlation between crude oil and the VIX Index has recently turned positive, a mean-reversion back to its historical relationship is likely. As such, sustained lack of volatility and destabilizing blows to appetite for risk could help facilitate a retracement higher in the price of crude oil.
-- Written by Rich Dvorak, Junior Analyst for DailyFX.com
Connect with @RichDvorakFX on Twitter for real-time market insight


