


Crude Oil Price Forecast Talking Points:
- The ONE Thing: Uptrend stalls as IEA cuts 2018 Oil demand forecast. The International Energy Agency said that WTI crude oil at $70 would take a toll on consumption and as such, they cut their forecasts for global oil demand growth. The lack of demand has caused the price trend to pause, but no signs of reversal are present. The first key sign of a significant break lower would be on a breakdown and close below $69.76/68.76/bbl.
- Wednesday’s EIA Crude Oil Inventory Report showed surging exports and falling stockpiles: Export data has become as much of a headline in the US EIA Crude Oil Inventory Report as the traditional inventory data that helps to show downstream demand. Exports from the US surpassed 2.5 million barrels a day, and such aggressive exports are re-igniting talks of ‘Saudi America,’ a moniker aimed at showing the US is becoming a global driver of the oil market.
- Downstream demand is on fire: Gasoline inventories dropped aggressively on gasoline exports nearing 1m bpd.Distillate inventories additional remain near their five-year seasonal low.
- WTI Crude Oil Technical Analysis Strategy: Technical support holds at the at the May 8 low of $67.63/bbl while momentum remains bullish above $68.76/bbl, the 26-day midpoint. Selling above these levels may prove costly.
- Access our recent Crude Oil Fundamental Forecast here
KEY TECHNICAL LEVELS FOR WTI Crude Oil:
- Resistance: $76.99/bbl – 61.8% Retracement of 2014/2016 price range
- Spot: $71.15/bbl
- Support: $67.56/bbl – May 8 low, pre-Iran announcement from US President Trump
240-Minute NYMEX WTI – Crude Oil: Momentum Remains Bullish
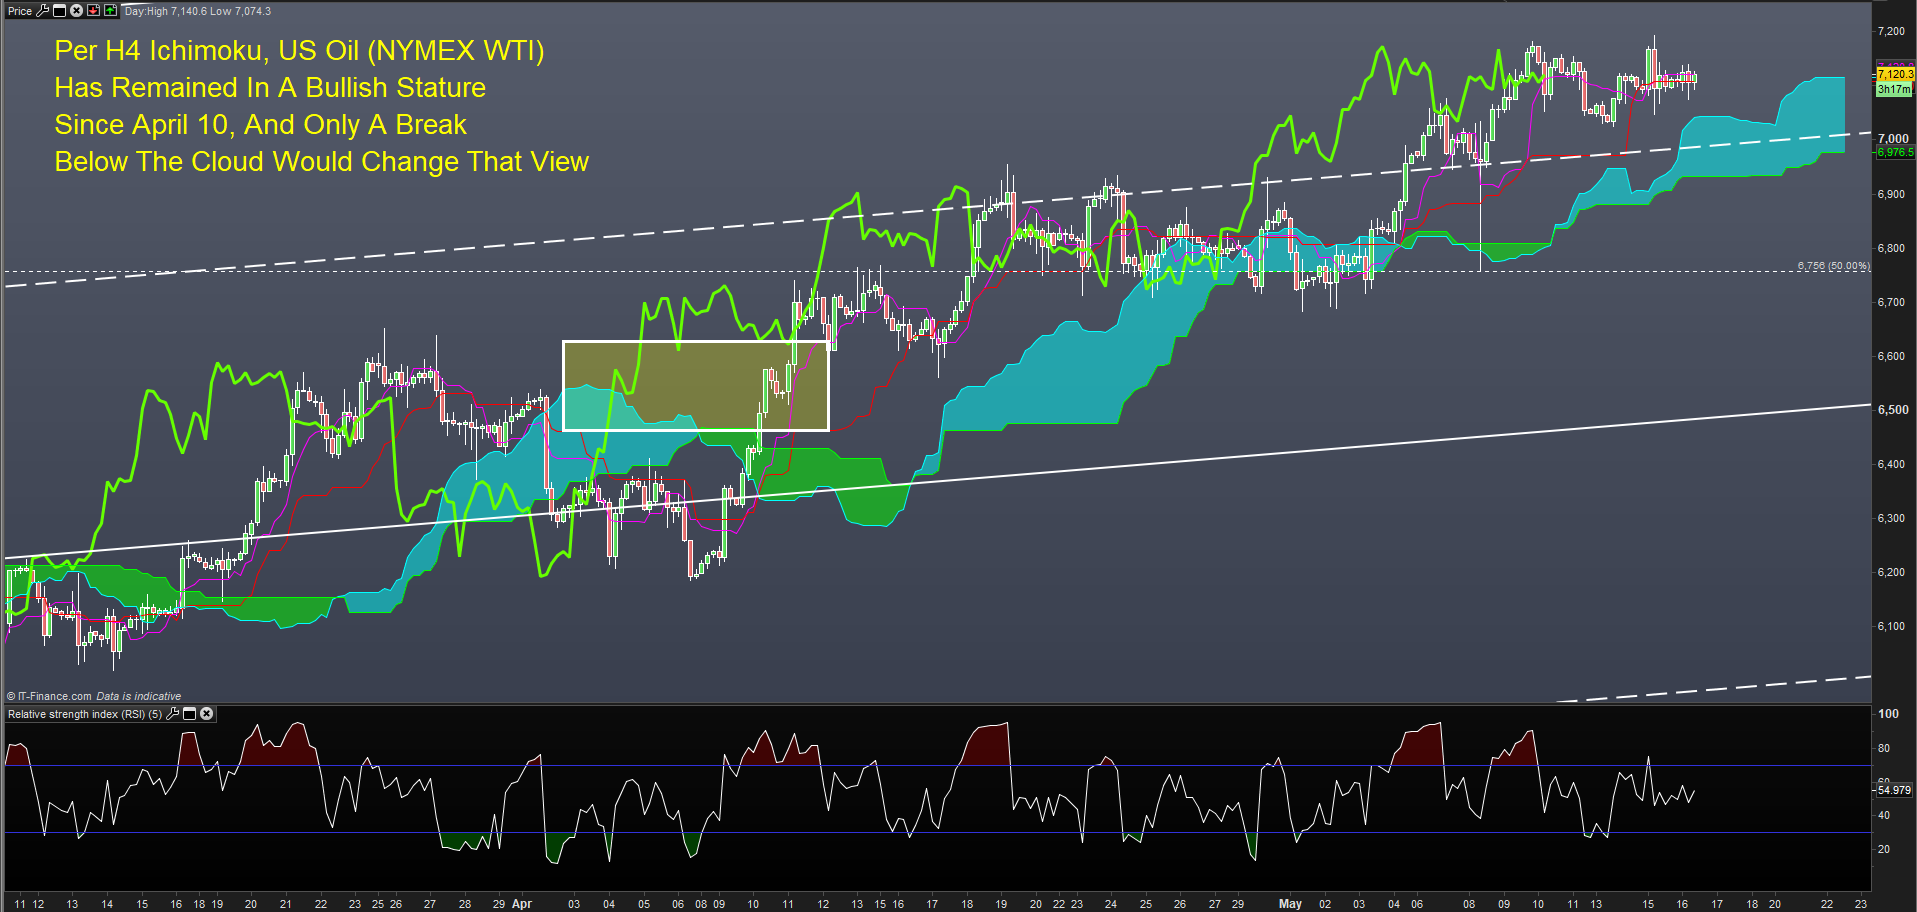
Chart Source: Pro Real Time with IG UK Price Feed. Created by Tyler Yell, CMT
Since April 10, WTI crude oil has traded above the four-hour Ichimoku cloud, and the lagging line (price against 26-periods ago) has shown momentum remains bullish. Under the view that momentum leads price, a bullish view will hold unless a close below $68.76 and $67.56 develop.
Unlock our Q2 18 forecast to learn what will drive trends for Crude Oil in a volatile Q2
LT Technical Analysis – WTI Crude Oil Stays In Bullish Standing > $67.56/BBL
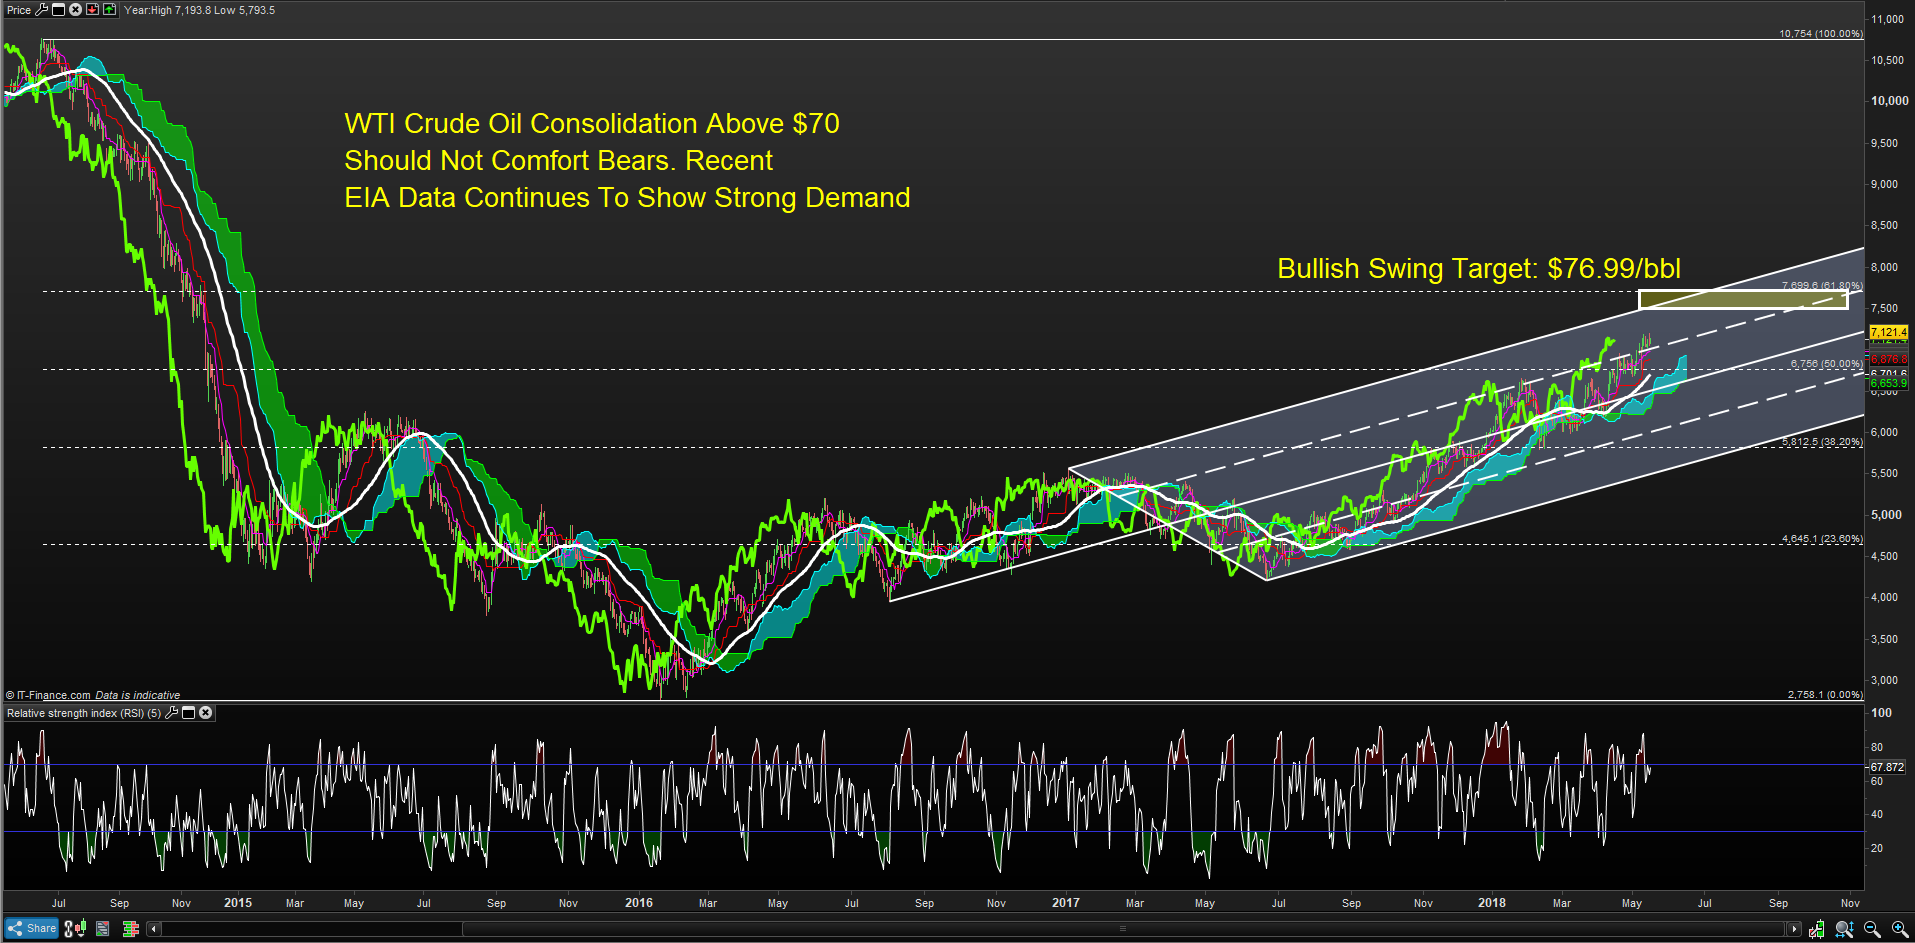
Chart Source: Pro Real Time with IG UK Price Feed. Created by Tyler Yell, CMT
The long-term chart seems to show a sluggish, yet stalwart move toward the 61.8% retracement of the 2014/2016 price range at $76.99.
Markets are said to take the stairs higher and the elevator lower. The chart above shows both dynamics as it captures the massive drop in 2014 that mirrored the 2008/2009 drop toward lower levels and the recent rise from the January 2016 low.
When a trend is as strong as we see in crude, it’s often best to sit back and ask, at what level of support would be a break below change my bullish view?
On the prompt WTI contract, that would be the 26-day midpoint per Ichimoku at $68.76 to the May 8 low last week at $67.56. Absent a break below this zone, it’s hard to say a top is in as momentum tends to lead price in markets, and crude is no exception.
Recommended Reading: 4 Effective Trading Indicators Every Trader Should Know
More for You:
Are you looking for longer-term analysis on Crude Oil and other popular markets? Our DailyFX Forecasts for Q2 have a section for each primary currency, and we also offer an excess of resources on USD-pairs such as EUR/USD, GBP/USD, USD/JPY, AUD/USD. Traders can also stay up with near-term positioning via our popular and free IG Client Sentiment Indicator.
Forex Trading Resources
DailyFX offers a surplus of helpful trading tools, indicators, and resources to help traders. For those looking for trading ideas, our IG Client Sentiment shows the positioning of retail traders with actual live trades and positions.
Our trading guides bring our DailyFX Quarterly Forecasts and our Top Trading Opportunities, and our real-time news feed has intra-day interactions from the DailyFX team. And if you’re looking for real-time analysis, our DailyFX Webinars offer numerous sessions each week in which you can see how and why we’re looking at what we’re looking at.
If you’re looking for educational information, our New to FX guide is there to help new(er) traders while our Traits of Successful Traders research is built to help sharpen the skill set by focusing on risk and trade management.
---Written by Tyler Yell, CMT
Tyler Yell is a Chartered Market Technician. Tyler provides Technical analysis that is powered by fundamental factors on key markets as well as trading educational resources. Read more of Tyler’s Technical reports via his bio page.
Communicate with Tyler and have your shout below by posting in the comments area. Feel free to include your market views as well.
Discuss this market with Tyler in the live webinar, FX Closing Bell, Weekdays Monday-Thursday at 3 pm ET.
Talk markets on twitter @ForexYell


