


Crude Oil Price Forecast Talking Points:
- WTI Crude Oil Technical Analysis Strategy: buying dips above support $55.83/bbl
- EIA Crude Oil Inventory Report further drop in Crude stockpiles
- Trader Sentiment Highlight from IG UK: bullish bias developing from contrarian indicator
Crude Oil Bulls are likely feeling pretty smart at the start of 2018. The price of Crude Oil has traded to the highest level in three years after hitting $62/bbl as a large stock of inventories in the US continues to fall as positive US economic data forces a draw.
Further drop in Crude Inventories Spur Hope in Oil Bulls
The first EIA Crude Oil Inventory Report of 2018 showed that the trend of declining inventories carried on to the cheer of Bulls. The downside was that refined products were not depleted as fast as crude inventories, which some may argue as a drop in downstream demand however refiners are producing at the highest levels on record. Therefore, it's expected that the absolute inventory levels would not drop very aggressively.
2018 is expected to be a pivotal year as the physical market continues to tighten. Demand is seen permeating throughout the world and as the global stockpiles are depleting, the price could remain supported even if the gains are not as robust as they were in 2017.
Institutional Speculators (Blue) Loading Up on Long WTI Crude Positioning
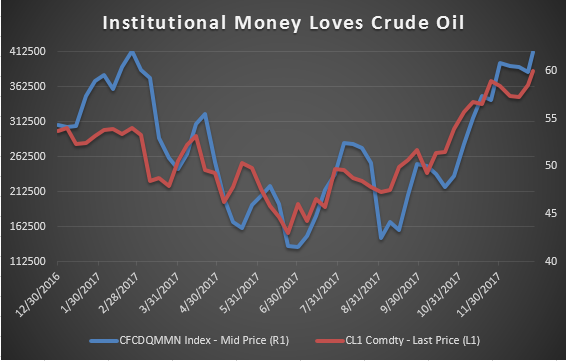
You can see on the chart above the CoT report that shows Managed Money Net (blue line) positioning has recently pushed toward the highest level in a year. Traders should take note that the fundamental backdrop (spreading demand and falling inventories) and technical position of an uptrend (higher highs and higher lows) does not favor fighting this multi-faceted trend.
Technical Levels for WTI Crude Oil
Short-term price support can be found at prior resistance at $59.05, which was a price target that price eventually broke through in late December. A break below $59.05 would indicate the immediate trend has shifted to neutral, but it would likely take a break below $55.83 to shift from neutral to medium-term bearish. Until that event surfaces, traders would do well to anticipate further gains.
Unlock our Q1 18 forecast to learn what will drive trends for Crude Oil at the open of 2018.

Chart created by Tyler Yell, CMT. Tweet @ForexYell for comments, questions
WTI Crude Oil Insight from IG Client Positioning

We typically take a contrarian view to crowd sentiment, and the fact traders are net-short suggests Oil - US Crude prices may continue to rise. Positioning is more net-short than yesterday but less net-short from last week. The combination of current sentiment and recent changes gives us a further mixed Oil - US Crude trading bias.
---
Written by Tyler Yell, CMT, Currency Analyst & Trading Instructor for DailyFX.com
To receive Tyler's analysis directly via email, please SIGN UP HERE
Contact and discuss markets with Tyler on Twitter: @ForexYell


