


Key Highlights:
- Crude Oil Technical Strategy: watching price attempt on $48, break > could signal trend shift
- Saudi Exports to US fell to lowest level since 2010, showing Riyadh making good on promises
- WTI breaks above $47/bbl on 4.73m decline in Crude inventories
- IGCS Sentiment highlight: Decline in long positions provides contrarian signal to look for upside
To be fair the trend has not changed in Crude Oil. We continue to trade in a falling bearish channel making lower highs and lower lows. However, it’s worth trying to connect the dots when positive developments arise to see if they can find momentum to act as a catalyst to a Bullish reversal.
On Wednesday, after the EIA released the data that Crude Inventories declined by 4.73m barrels and that Saudi was delivering less crude, holding true to their comittment may act as a force for higher prices. Of course, as we continue to see in Friday’s Baker Hughes data, UUS production continues to push higher and acts as a road block for a significant price recovery. However, as we see increased gasoline demand (+2.1% YoY), a weaker USD and an overall supportive report from the EIA, it’s worth it to keep an eye on the charts to see if a breakout could be in the works.
As the calendar rolls to the 2nd Half of 2017, click here to see the opportunities in Oil.
There are a handful of technical highlights to watch for that would act as catalysts for a Bullish recovery if the price exceeds. First, the opening range high for the 2nd half of 2017 (first two weeks of July) sits $47.29, Second, the combination of the daily Ichimoku Cloud and Bearish price channel (downward sloping – red) align near $48.20-$47.50. Lastly, the 61.8% Fibonacci Retracement of the May to June range rests at $48.20. A break above the zone $47.29-$48.20 on a daily closing basis should be watched to combine with a desperately awaited Oil recovery.
While the dots may be in place to be connected, it’s worth noting that without a price recovery, these points mentioned above (Saudi cutting back on US exports, increased Gasoline demand, 4.7m barrel inventory draw), remain unfulfilled anecdotes to a Bullish thesis. Lastly, we have seen a strong move off long-term support, which could also show that should a break above $48.20 develop, a base may be set. Maybe. A reversal lower from resistance would turn attention back to long-term support at $43.50/42 per barrel.
JoinTylerin his Daily Closing Bell webinars at 3 pm ET to discuss tradeable market developments.
After an encouraging EIA report, Oil turns focus to resistance ($47.29-$48.20/ barrel)
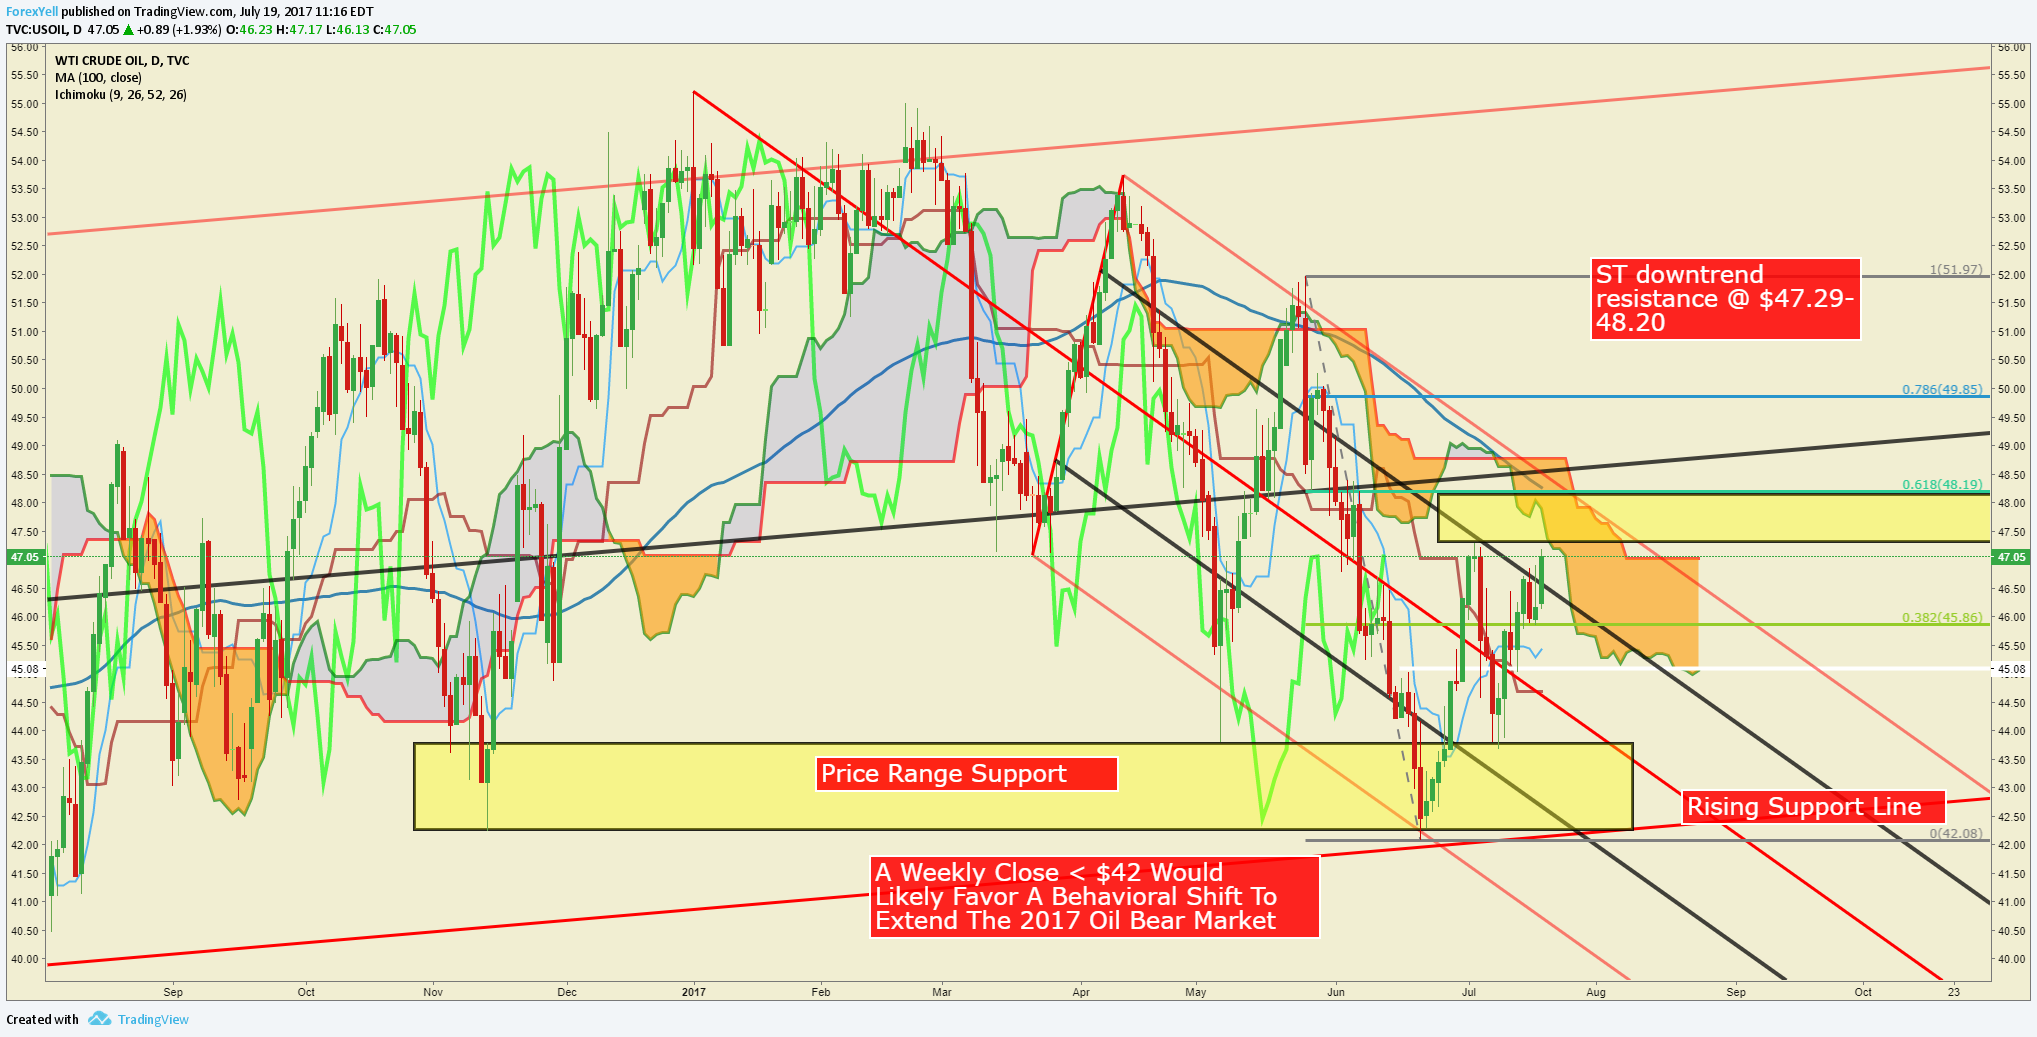
Chart Created by Tyler Yell, CMT
Crude Oil Sentiment: Decline in long positions provides contrarian signal to look for upside
The sentiment highlight section is designed to help you see how DailyFX utilizes the insights derived from IG Client Sentiment, and how client positioning can lead to trade ideas. If you have any questions on this indicator, you are welcome to reach out to the author of this article with questions at tyell@dailyfx.com.

---
Written by Tyler Yell, CMT, Currency Analyst & Trading Instructor for DailyFX.com
To receive Tyler's analysis directly via email, please SIGN UP HERE
Contact and discuss markets with Tyler on Twitter: @ForexYell


