


Highlights:
- Crude Oil Technical Strategy: price at critical pivot point, break below $42, favors strong drop
- A damning war of words among OPEC could disrupt if the ‘Shock & Awe’ effect fails
- Declining legacy wells in US shale region may eventually bring supply in line with demand
- IGCS Sentiment highlight: Bold Bulls may favor further downside for Crude
Safe to say that OPEC gatherings are about to get a shade more uncomfortable. On Monday, rumors leaked that Saudi was likely to ask that Libya and Nigeria to cut production as their increased production was overshadowing the intended positive effect of Saudi’s cuts. However, reports from Bloomberg have stated that Saudi Arabia itself is reporting to OPEC officials that they pumped 10.07 million bpd in June up from 9.88m in May and exceeding their limit for the first time since the production curb deal they helped broker. Either way, the minimal excess production will likely give Libya and Nigeria reason to state they were justified in overproduction due to high summer demand, but we continue to be a ways off from the hoped for Shock and Awe to scare markets to bid Oil higher.
One “positive development” is the dying off of legacy rigs in the shale regions that have been responsible for so much production in the last few years. The main argument is that legacy, or older oil wells are relatively expensive to maintain and to produce less than their recently completed and funded counterparts. A retiring of legacy wells could eventually lead to significant production decline at an overall lower cost, but it’s fair to say the this may not come as soon as OPEC and other stakeholders in the energy industry hope.
The EIA report that shows new production and legacy decline illustrates that 300-400k bpd is needed from new rigs to help offset retiring legacy rigs. I would argue that as oil stays at depressed levels, projects that had been approved or planned to be implemented will come offline, which over time could help balance the oversupply issue. However, this is not a quick fix, though a natural one, and could mean aside from a ‘Shock & Awe’ moment, we could be in for an early winter in terms of bullish crude oil prospects.
As the calendar rolls to the 2nd Half of 2017, click here to see the opportunities in Oil.
When looking at the chart, we appear to be fighting off an imminent move to a deeper bear market. The “line in the sand” on the chart is the base of the shaded rectangle drawn from the price range of the extreme day in November before price would eventually move higher to $55/bbl. A weekly close below $42/bbl would not only complement the fundamental picture above but continue the 2017 trend lower and likely signify a deep bear market that will have no quick solution despite OPEC’s best-laid plans and intentions. Only a weekly close above $48 would shift the view from bearish to neutral. A break above $52, though highly in doubt would turn the picture back to a Bull market.
JoinTylerin his Daily Closing Bell webinars at 3 pm ET to discuss tradeable market developments.
Crude Oil price action around $42/bbl remains a crucial lever to determine if the bear market worsens

Chart Created by Tyler Yell, CMT
Crude Oil Sentiment: Bold Bulls may favor further downside
The sentiment highlight section is designed to help you see how DailyFX utilizes the insights derived from IG Client Sentiment, and how client positioning can lead to trade ideas. If you have any questions on this indicator, you are welcome to reach out to the author of this article with questions at tyell@dailyfx.com.
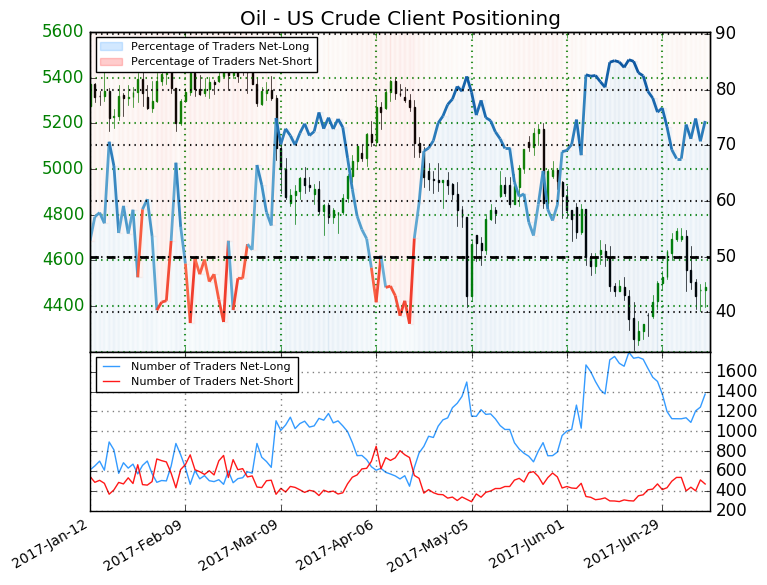
Oil - US Crude: Retail trader data shows 74.4% of traders are net-long with the ratio of traders long to short at 2.9 to 1. In fact, traders have remained net-long since Apr 19 when Oil - US Crude traded near 5271.1; theprice has moved 15.0% lower since then. The number of traders net-long is 8.1% higher than yesterday and 21.4% higher from last week, while the number of traders net-short is 16.4% lower than yesterday and 12.4% lower from last week.
We typically take a contrarian view to crowd sentiment, and the fact traders are net-long suggests Oil - US Crude prices may continue to fall. Traders are further net-long than yesterday and last week, and the combination of current sentiment and recent changes gives us a stronger Oil - US Crude-bearish contrarian trading bias. (Emphasis Mine)
---
Written by Tyler Yell, CMT, Currency Analyst & Trading Instructor for DailyFX.com
To receive Tyler's analysis directly via email, please SIGN UP HERE
Contact and discuss markets with Tyler on Twitter: @ForexYell


