


To receive Tyler’s analysis directly via email, please SIGN UP HERE
Talking Points:
- Crude Oil Technical Strategy: Favoring Downside Continuation < $43.50/bbl
- 38.2% Fibonacci Retracement Stalls Recent Oil Price Recovery
- Sentimental Trading System Continues To Flash Sell Signals
Access Our Free Q3 Oil Outlook As Oil's Best Quarter Looks For Confirmation
We are beginning to see an environment of overproduction once again. OPEC has noted that Saudi’s July output, whose capacity is extreme, was at a record of 10.6M bpd in July. The price of WTI Crude Oil (CFD: USOil) fell rather aggressively on Wednesday afternoon after the DoE had confirmed the API Crude Oil Inventories rose 1.05M barrels. This aligns with a steady increase in the active rigs shown on Friday afternoon’s Baker Hughes Rig Count. As noted in our last note, Hedge Funds have built up an aggressive short position on Oil, which last week touched Bear Market territory from the June high with both Futures and Options positions.
While the DoE numbers that seemed to spark a mid-morning sell-off does not include Russian & Saudi production, which is sitting at record levels there is understandable fear that the market is bracing itself for a new flood of supply. One Intermarket factor that appears to be supporting the price of Oil, or at least limiting the slope of the descent is a sanguine US DOLLAR, which recently fell away from 12,000 again.
Track short-term Crude Oil price levels and patterns with the GSI indicator!
In addition to the concerns of OPEC and other Oil-dependent countries, traders should be on the watch for a more overwhelming supply glut. For now, it seems difficult to draw a credible Bullish picture with the oversupply facing the market again.
Crude Oil Price Chart Falls Against 38.2% Retracement Level of Recent Drop
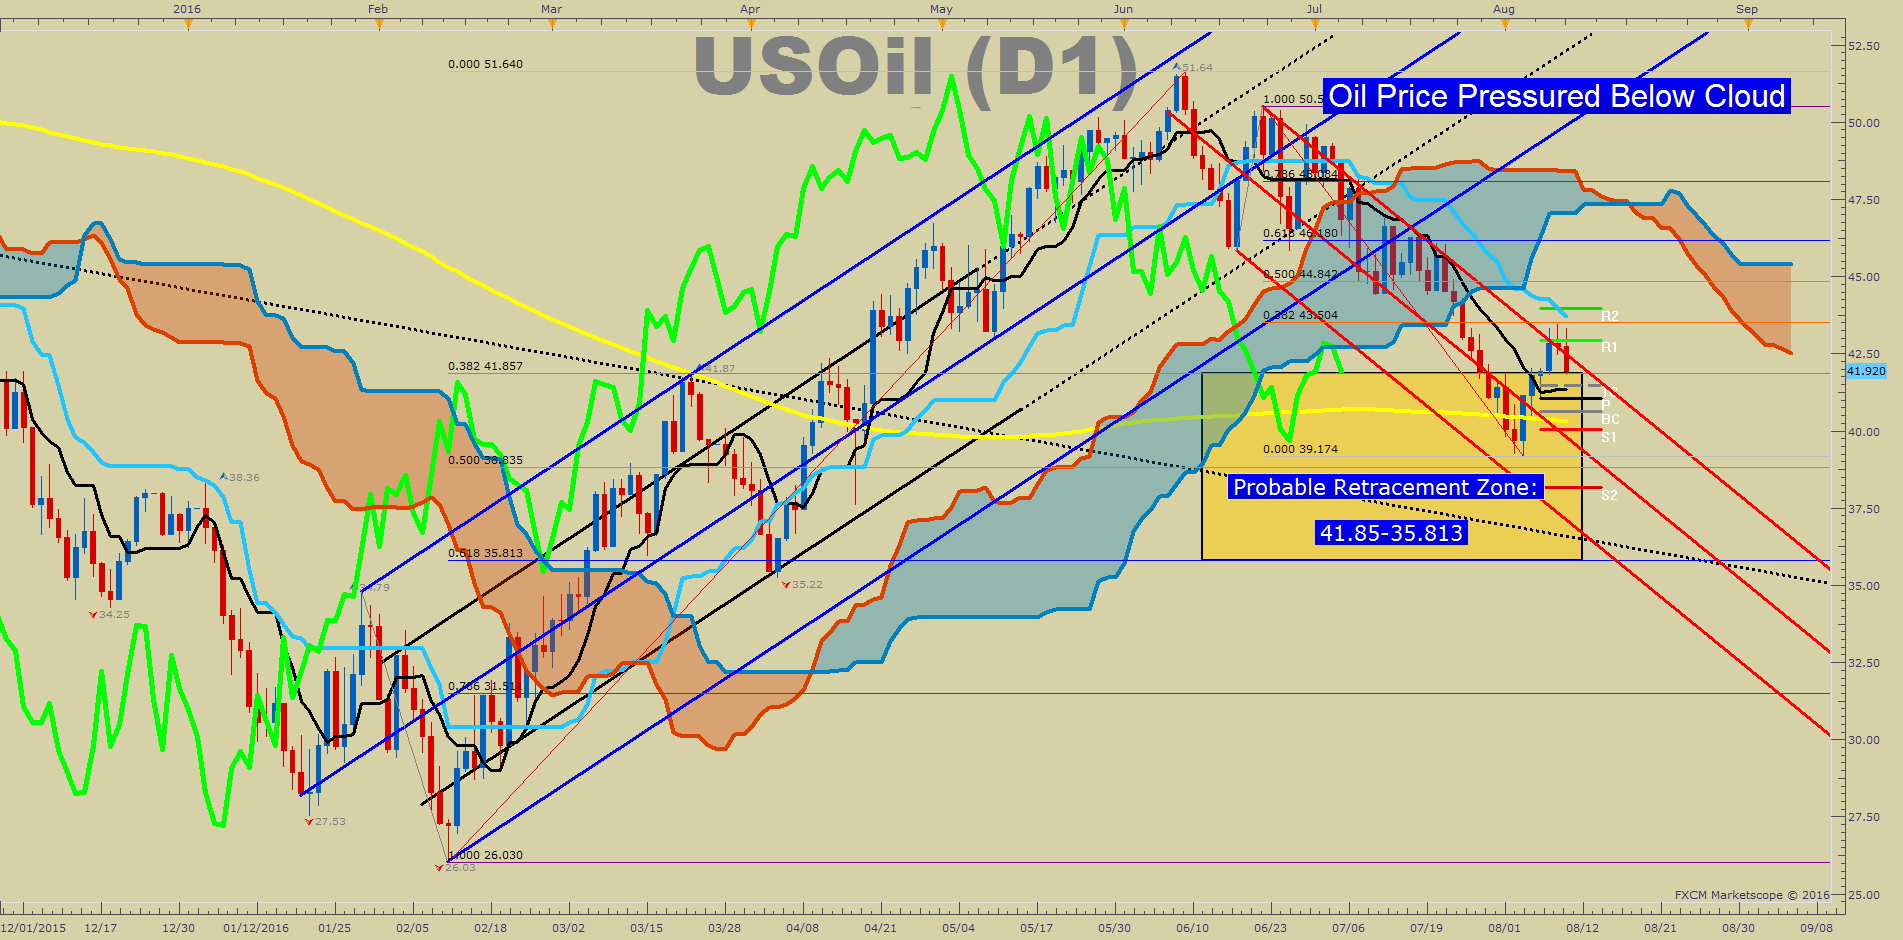
The price of WTI Crude Oil has traded very cleanly within a bearish price channel (red) shown in the chart above. If nothing else, the August Opening Range high of $43.50/bbl that aligns with the 38.2% Fibonacci Retracement of the $50.51-39.17 price zone should be seen as clear resistance before Bulls get too confident. Therefore, for now, the Bearish view will be favored on the price sustaining below the ~$44/bbl zone.
As long as price remains in the bearish price channel, we would naturally target the August Opening Range low at $39.17/bbl. A break below could easily show the Bears have regained control on a Monthly Opening Range breakdown, which would align with the fundamental story above. Lastly, the Ichimoku Cloud clearly is favoring further downside as price, and the momentum line (bright green) is below the cloud, which argues that price shocks are most likely to occur on the downside.
Regarding finding a zone where the selling pressure may slow down, we have long been a fan of the 38.2%-61.8% Fibonacci Retracement Zone of the February-June Range that encompasses $41.85-$35.81/bbl for a potential turnaround in the price of Oil.
Bottom Line:
The question has now become whether or not we are on the verge of a new break-down in Oil that will test the $30 handle again. Since price momentarily reached Bear Market status last week, it’s worth noting OPEC countries and companies who were benefiting from the rise in Oil prices are feeling the squeeze in a similar manner of 2014-early 2016. Furthermore, 2017 would be unbearable for many sovereign budgets that depend on the price of Oil.
However, talk is cheap, and position pressure speaks volumes. The record short exposure without a definitive plan to cut oversupply may leave this market heavy with a bias to retest and break below the 200-DMA.
Performance Chart For CL1 From Today To YTD
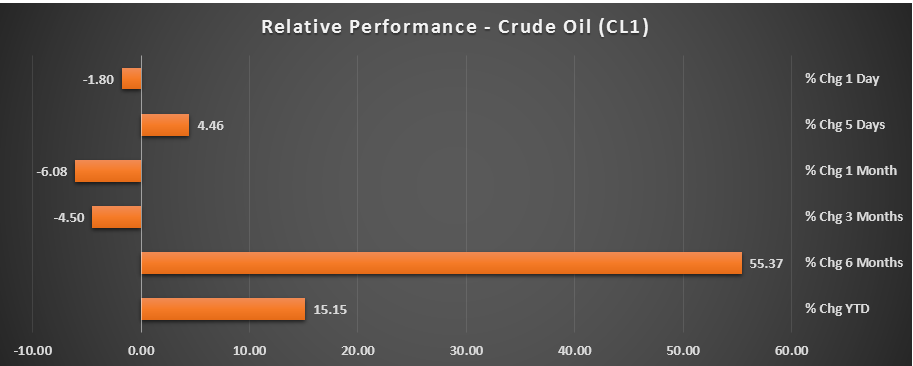
Created by Quasar Elizundia, DailyFX Research Team
Contrarian System Warns of Further Downside as of 8/10/16
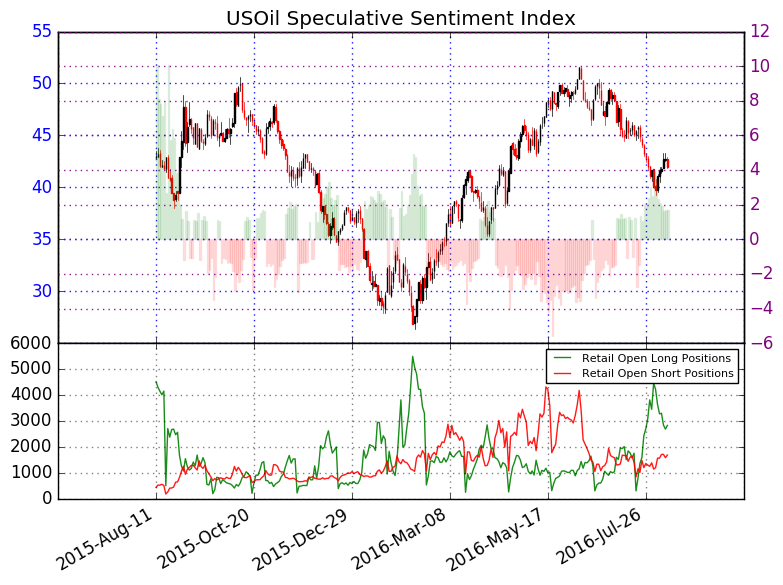
In addition to the technical focus around favoring furthering downside, we should keep an eye on retail sentiment. Further downside is aligned with our Speculative Sentiment Index or SSI for now.
As of mid-day Wednesday, the ratio of long to short positions in the USOil stands at 1.70; 63% of open positions were long. Long positions are 4.7% higher than yesterday and 28.3% below levels seen last week.
We use our SSI as a contrarian indicator to price action, and the fact that the majority of traders are long gives a signal that the USOil may continue lower. The trading crowd has grown less net-long from yesterday and last week. The combination of current sentiment and recent changes gives a further mixed trading bias.
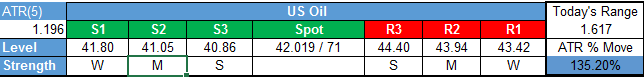
Key Levels Over the Next 48-hrs of Trading As of Monday, August 10, 2016
T.Y.
Think Oil has more room to run? Trade Oil With Low Margin Requirements (non-US Residents only)


