


To receive Tyler’s analysis directly via email, please SIGN UP HERE
Talking Points:
- Crude Oil Technical Strategy: Support at $48 Remains ST Pivotal For Remaining Bullish
- Momentum + Stockpile Draw = Oil > $50bbl
- Sentimental Trading System Shows Upside Signal Strengthening
An Erosion of oversupply has become the theme of the Oil Market in 2016. While there is still pain being felt on the business side, the momentum that comes with being ‘the only game in town,’ has brought Oil above $50 for the first time since October.
The risk-on sentiment (global stocks and commodities remaining supported) has frustrated investors and traders that bought in (few would blame them) to the financial Armageddon 2.0 scenario that appeared to be playing out in the first two months of the year. For those that fear we’ve gone too far too fast, that’s fair, but it doesn’t appear to be worth shorting on that alone given the sustainability of momentum despite retail positioning.
Compete to Win Cash Prizes With Your FXCM Mini Account, Click Here For More Info
On Wednesday, the EIA inventory data and Cushing Stock depletion helped to confirm recent sentiment that there are large draws on current supplies. This fundamental development has aligned with disruptions of supply in Nigeria to support price now around $50/bbl.
Wednesday’s EIA numbers came in at a 4.2m bbl decline in crude stockpiles. Thankfully, the disruptions in Crude from the Canadian Wildfires don’t appear to be long-lasting as Canadian oil-sands facilities that workers evacuated last week due to wildfires are being allowed to prepare for the restart. However, Nigerian conflict continues to reduce overall supply, and there has been no definitive word from the folks at Doha about increasing supply to take advantage of $50 Oil, though they most assuredly are.
Key Support & Resistance Levels from Here (Visual Map Below)
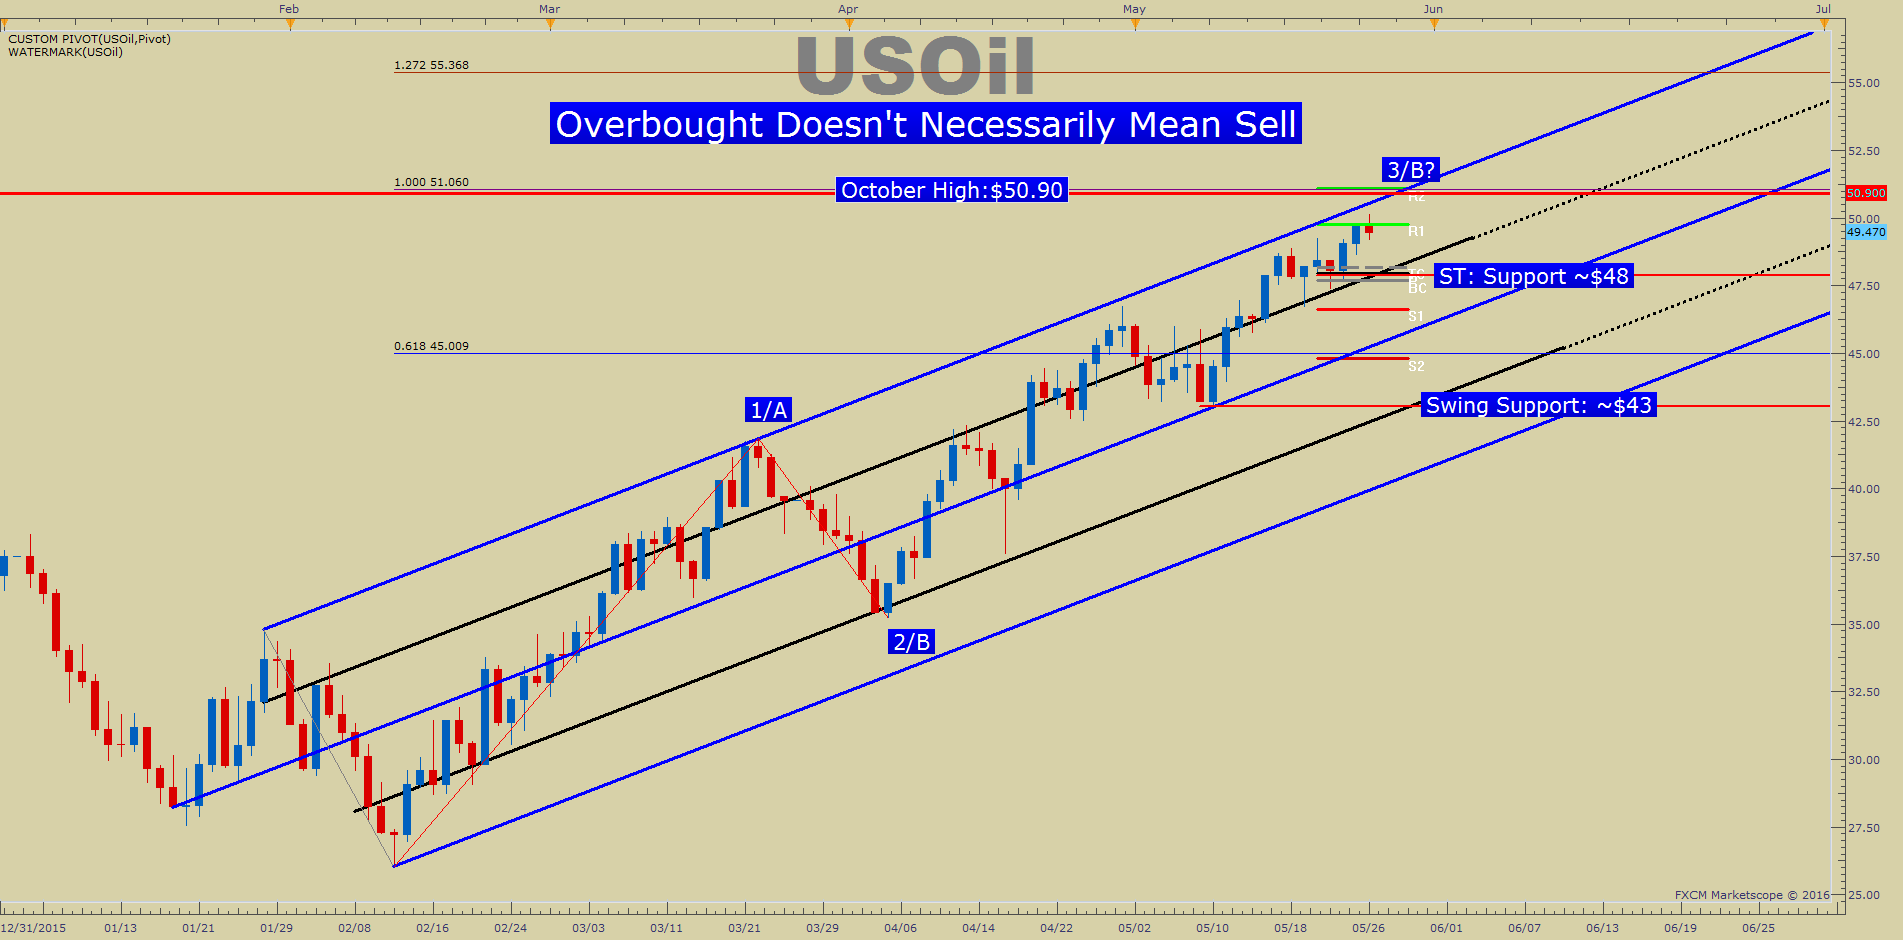
Looking at the chart, since bouncing off the $43 level to piercing $50/bbl on Thursday morning, the market appears determined to buy dips toward multi-day lows despite the retail crowd’s intentions (shown below). The recent low worth focusing on appears to be near the Weekly Pivot, which is close to $48 and appears to be a good support to favor staying long or at least, not to pay attention to getting short until it breaks.
Below $48, is the May low of ~$43/bbl. A break below would not only take out two key levels of support but the price channel (Blue) that we’ve traded higher in since Mid-February would also be broken. Breaking out of a multi-month price channel is a helpful way to see there is a change in behavior that might indicate the Bull move is over, or at least a larger retracement is under way that could have us test the ~35/bbl region, which houses 61.8% Fibonacci retracement of the February-May Range.
Price hit new 2016 highs today. Therefore, current resistance is the confluence of the Weekly R2 Pivot, the 100% Fibonacci Expansion taken from the April Opening Range Low, and the October High. This range encompasses $50.90-51.09/bbl. Beyond there, price looks only to be targeting higher, and other hard resistance levels appear arbitrary at best.
While $50/bbl is a good psychological level that may still hold, there is a potential that the risk-on rally in 2016 has benefited commodities the most. This environment may mean that Oil could easily get bid-up well through $50 on money moving from not only risk-off assets to Oil but also from lower performing risk-on assets like stocks. Either way, the layers of support should be watching to hold Oil up on its way to and possibly through $50/bbl.
Contrarian System Warns of Further Upside As of 5/26/16
“The market can stay irrational longer than you can stay solvent.”
John Maynard Keynes, (attributed), English economist (1883 - 1946)

In addition to the technical focus around multiple support-zones, we should keep an eye on retail sentiment, which favors more upside price action. Further upside is currently aligned with our Speculative Sentiment Index or SSI for now.
The ratio of long to short positions in the USOil stands at -3.38 as 23% of traders are long. Short positions are 15.1% higher than yesterday and 15.1% above levels seen last week. Open interest is 14.3% higher than yesterday and 10.6% above its monthly average. We use our SSI as a contrarian indicator to price action, and the fact that the majority of traders are short gives a signal that the USOil may continue higher. The trading crowd has grown further net-short from yesterday and last week. The combination of current sentiment and recent changes gives a further bullish trading bias.
Key Levels Over the Next 48-hrs As of Monday, May 26, 2016

T.Y.
Think Oil has more room to run? Trade Oil With Low Margin Requirements (non-US Residents only)


