


To See How FXCM’s Live Clients Are Positioned In FX & Equities Click Here Now.
Talking Points:
- Crude Oil Technical Strategy: Oil Bounces To Trendline/ MVA Resistance
- The US Dollar Has Found a Bid For the First Time in February Putting Pressure on WTI
- Trendline Resistance From November Highs Appears A High Hurdle For Bulls To Climb
"In the second half, every tank and swimming pool in the world is going to fill, and fundamentals are going to kick in… The market will start balancing in the second half of this year.”Robert W. Dudley, Group Chief Executive, British Petroleum, February 10, 2016
The Only Certainty: Volatility
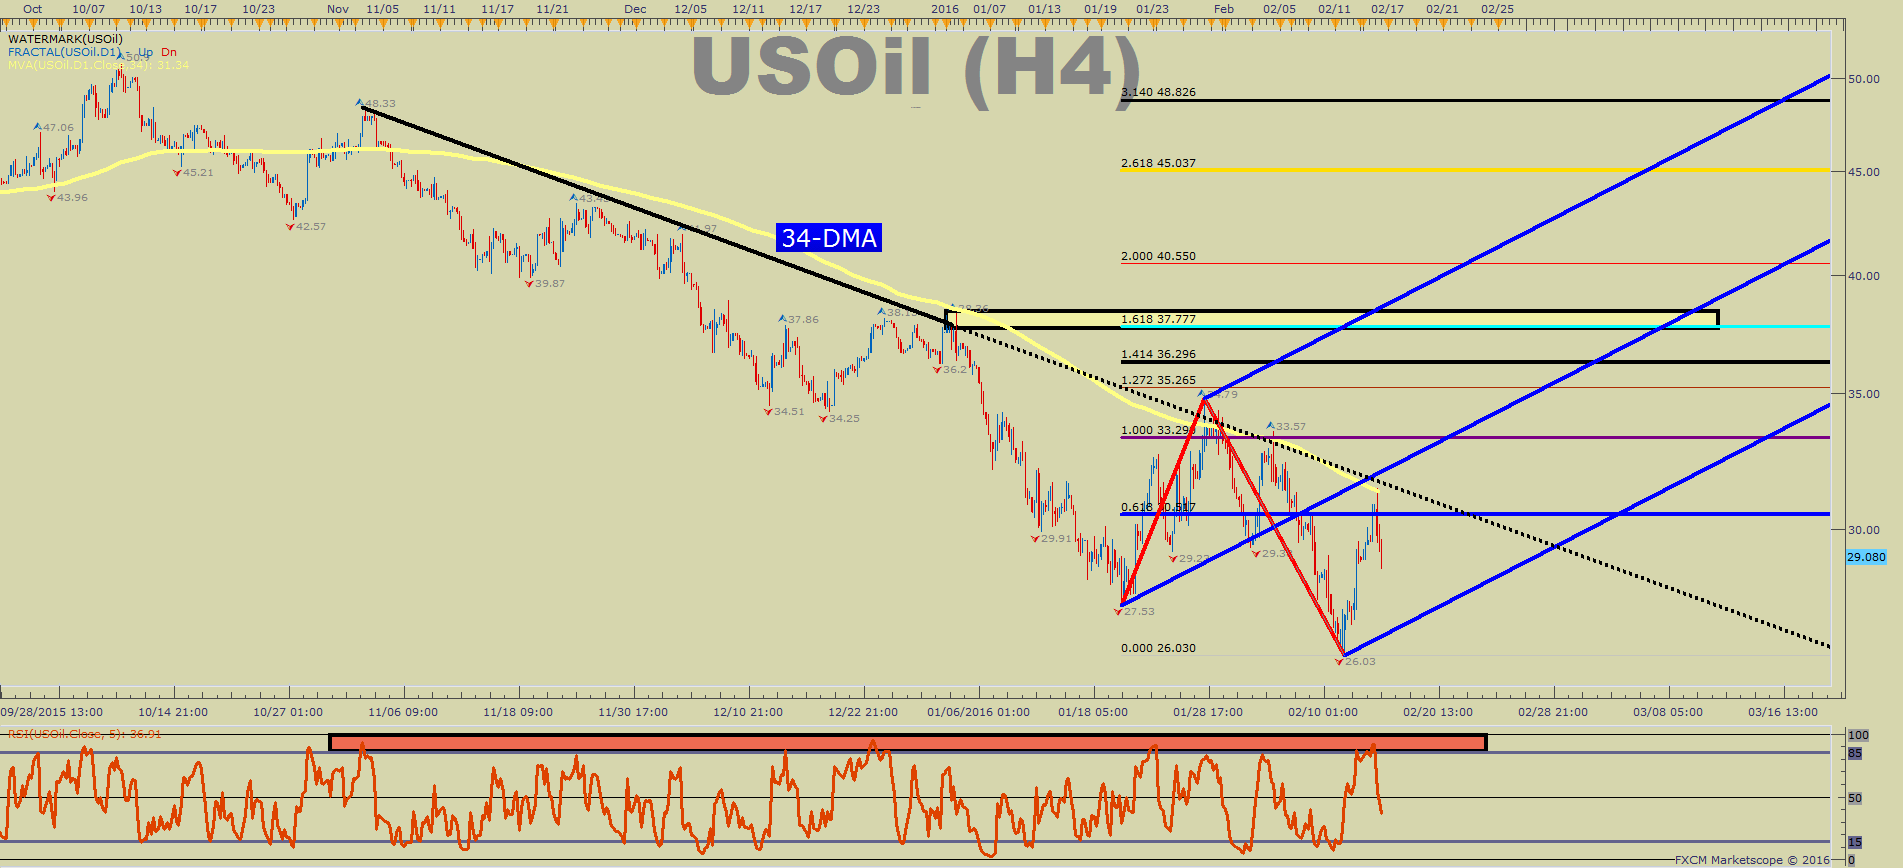
Last Week , the price of WTI Crude Oil hit 12.5-year lows around $26/bbl. Over the next three days, Oil proceeded to rally by 20% into the 34-day moving average. Unfortunately, the top in the price of Oil on Tuesday aligned with an announcement from a Genscape Report that noted an expectation that the build in inventory at Cushing was likely to rise by 705,000 this week. In addition, the outcome of the Saudi Arabia, Russia meeting was to Freeze Oil output, which caused traders to believe the Glut of Oil will persist without a cut and more producers on board. .
Naturally, markets will look to the delayed API & DoE reports this week for confirmation, but selling action aligning with this print seems to show the uncertainty and unease around the potential storage capacity hitting max levels this year for WTI producers.
The quote above from BP CEO Robert Dudley has been making the rounds over the last week as it poignantly states how CEOs of large exploration & producing oil companies are feeling about the seemingly never-ending supply build in the United States. Last week was International Petroleum Week in London, and we continued to hear comments from company heads that see a ‘lower for longer’ environment for the price of Oil. A continuation of weak prices on a supply glut continues to worry markets and aligns with our 2016 fundamental outlook on Oil.
US Oil Has met Trendline Resistance from November Highs Likely A High Hurdle for Bulls To Climb
Capture The Volatility In Oil With Low Margin Requirements. Learn more HERE (non-US residents only)
Key Levels from Here
While a production freeze is a significant outcome, albeit less supportive of higher Oil prices than a cut, the true test will be to see if the market can break and hold above key support near the 55-DMA. The 55-Day Moving Average aligns with a trendline drawn off the November price high near ~$48/bb. The price of Oil has consistently pushed lower after running into this zone of ~31.40-32.15/bbl.
Now, support will be watched for eager Oil bulls around the 26.19/24 Jan. 20 low and downtrend support. If that level is unable to hold, many traders will look below the January 20 low toward the April 2003 low of 25.04, followed by the June 2002 low of 23.80. Should the US Dollar strengthen further toward and beyond the 12,156 level, we could see US Dollar strength beginning to put pressure on the price of Oil again.
Contrarian System Warns of Further Price Pressure
In addition to the technical pressure that Oil may have found at trendline resistance, the larger bearish view aligns with our Speculative Sentiment Index or SSI. Our internal readings of Oil are showing an SSI reading of 2.5935. We use our SSI as a contrarian indicator to price action, and the fact that the majority of traders are now bullish provides a contrarian signal that US Oil may continue eventually lower. If the reading were to turn negative again, and the price broke back above $34.79bbl, we could begin looking for a retest of the YTD high of $38.36.
T.Y.
To receive Tyler’s analysis directly via email, please SIGN UP HERE


