


Japanese Yen Technical Analysis - Talking Points:
- USD/JPY has broken below important support but the move lacks conviction
- The retracement point in question has been a market anchor for two weeks
- EUR/JPY looks more clearly bearish but may have found a floor
The Japanese Yen’s fightback against the US Dollar remains stymied at retracement USD/JPY support which has been important for this market since March 29.
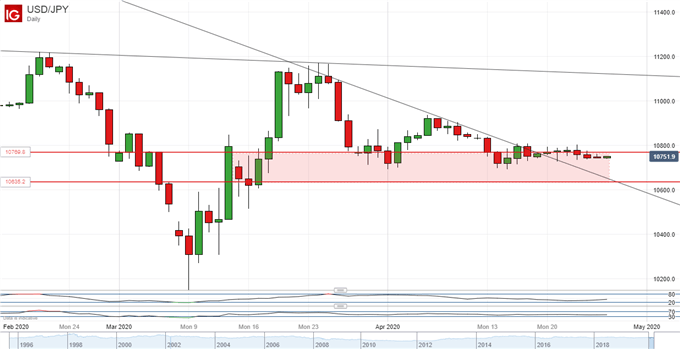
It comes in at 107.70, or the second 38.2% Fibonacci retracement of the rise up from the lows of March 9 to the peak of March 24.
The pair managed to break above its previously dominant daily-chart downtrend line on April 20, but the action seen since has hardly argued for much Dollar-bullish conviction. Narrow very narrow ranges have been seen since, suggesting a degree of uncertainty. The pair has managed to break below that 107.70 point, but, again, the break doesn’t yet look conclusive and Yen bulls clearly haven’t yet given up hope of defending it.
A slip back to trendline support at 106.55 might indicate that their problems were indeed growing. 50% retracement support of that same March rise lies just below there at 106.35.
April’s end could be instructive from the point of view of this apparent deadlock and with that in mind this may not be the time for the uncommitted to step back in. The market seems to effectively capped by April 16’s intraday high of 108.03 and, if there’s no appetite to take the Dollar back up even that far this week, then the easiest path could prove to be a continuation of the downtrend.
| Change in | Longs | Shorts | OI |
| Daily | -2% | 2% | 0% |
| Weekly | 12% | -16% | -6% |
Meanwhile the Euro looks more clearly bearish against the Japanese unit. The downtrend channel which started for EUR/JPY on March 26 remains in control of events.
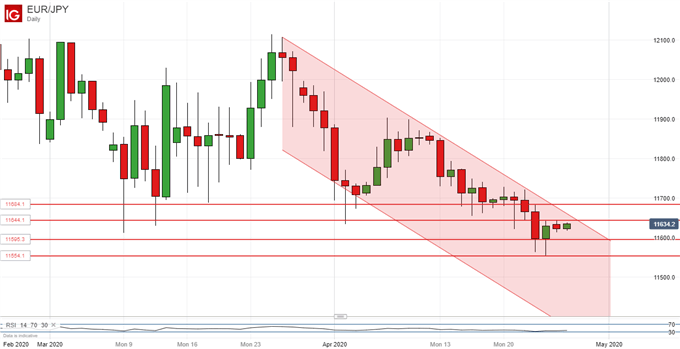
However it’s notable that the channel base has not seen a test since April 3 when Euro bears failed to breach it at 117.06,
Moreover the cross appears to have settled into a trading range within the channel which could see the upper boundary challenged this week. It’s close to the current market at 116.61. A break above this channel which endures through the end of April could be quite bullish for the Euro in the short term, but by the same token another failure to breach the channel could see the single currency set up for another leg lower.
Japanese Yen Resources for Traders
Whether you’re new to trading or an old hand DailyFX has plenty of resources to help you. There’s our trading sentiment indicator which shows you live how IG clients are positioned right now. We also hold educational and analytical webinars and offer trading guides, with one specifically aimed at those new to foreign exchange markets. There’s also a Bitcoin guide. Be sure to make the most of them all. They were written by our seasoned trading experts and they’re all free.
--- Written by David Cottle, DailyFX Research
Follow David on Twitter @DavidCottleFX or use the Comments section below to get in touch!


