


Japanese Yen Technical Analysis Talking Points:
- The Japanese Yen has gained against a broadly weaker US Dollar
- However USD/JPY is now near important retracement territory
- AUD/JPY remains well-bid but may need a rest
The Japanese Yen has made gains on a broadly weaker US Dollar for the past week, but USD/JPY is now closing in on a key support area.
Fundamentally, investors have been rethinking some of their Dollar-long positions as they weigh up the dawning US corporate earnings season’s chances. Technically USD/JPY now sits just atop a band of support formed by the 38.2% and 50% Fibonacci retracements of its rise from the lows of March 9 to the highs of March 25 -unsurpassed since.
They come in at 107.69 and 106.35, respectively and between them is a band in which the market has been reluctant to linger in the recent past. It traded out of it to the upside after four days following March 13, and in just one day on March 31.
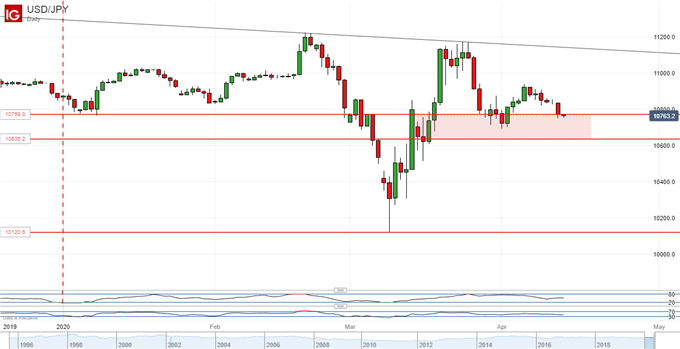
Right now the pair seems to be in the grip of a downtrend from those late March highs, itself merely an acceleration of the longer-term downtrend from February 20.
With that in mind it might be as well to watch the fate of that trading band again, with the direction of any break likely to offer broader directional clues. However, bear in mind that broad downtrend resistance doesn’t come in until 111.31 at this point, way above the market.
| Change in | Longs | Shorts | OI |
| Daily | -2% | 2% | 0% |
| Weekly | 12% | -16% | -6% |
By contrast the Australian Dollar is doing much better against the Japanese unit. The dominant daily-chart uptrend channel from the eleven-year lows of last month remains robustly in pace. It looks as though a test of its upper bound at 69.02 may fail, but that need hardly threaten the up-move to any great degree.
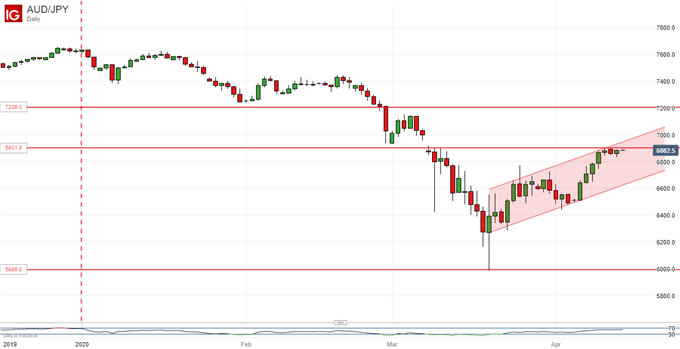
Still, there may be a bit of exhaustion setting in about now and a period of consolidation may have to be seen before Australian Dollar bills can contemplate the next leg higher. That would take them back to the highs of late February in the 72.06 region, but the market may well pause for breath between current levels and the 66.50 region which held sway in late March. If the bulls can hold matters around there, then it’s reasonable to expect further gains.
Japanese Yen Resources for Traders
Whether you’re new to trading or an old hand DailyFX has plenty of resources to help you. There’s our trading sentiment indicator which shows you live how IG clients are positioned right now. We also hold educational and analytical webinars and offer trading guides, with one specifically aimed at those new to foreign exchange markets. There’s also a Bitcoin guide. Be sure to make the most of them all. They were written by our seasoned trading experts and they’re all free.
--- Written by David Cottle, DailyFX Research
Follow David on Twitter @DavidCottleFX or use the Comments section below to get in touch!


