


GBP /JPY and USD/JPY Technical Analysis
- US Dollar and British pound price action against Japanese Yen
- USD/JPY and GBP/JPY charts and analysis
See Our latest trading guides for free and discover what is likely to move the markets through Q4 of this year.
GBP/JPY, USD/JPY – Hesitant Buyers
Yesterday, USD/JPY rallied to 109.28- its highest level in two months. However, the price slipped back and closed with a bearish doji pattern. On the other side, GBP/JPY peaked on oct 17 and printed 141.51- its highest level in nearly five months. Later, the uptrend move paused highlighting buyer’s hesitation at this stage.
Since Oct 10, the Relative Strength Index (RSI) has been moving above 50 on both pairs, indicating to uptrend momentum is still intact.
Having trouble with your trading strategy? Need a hand? Here’s the #1 Mistake That Traders Make
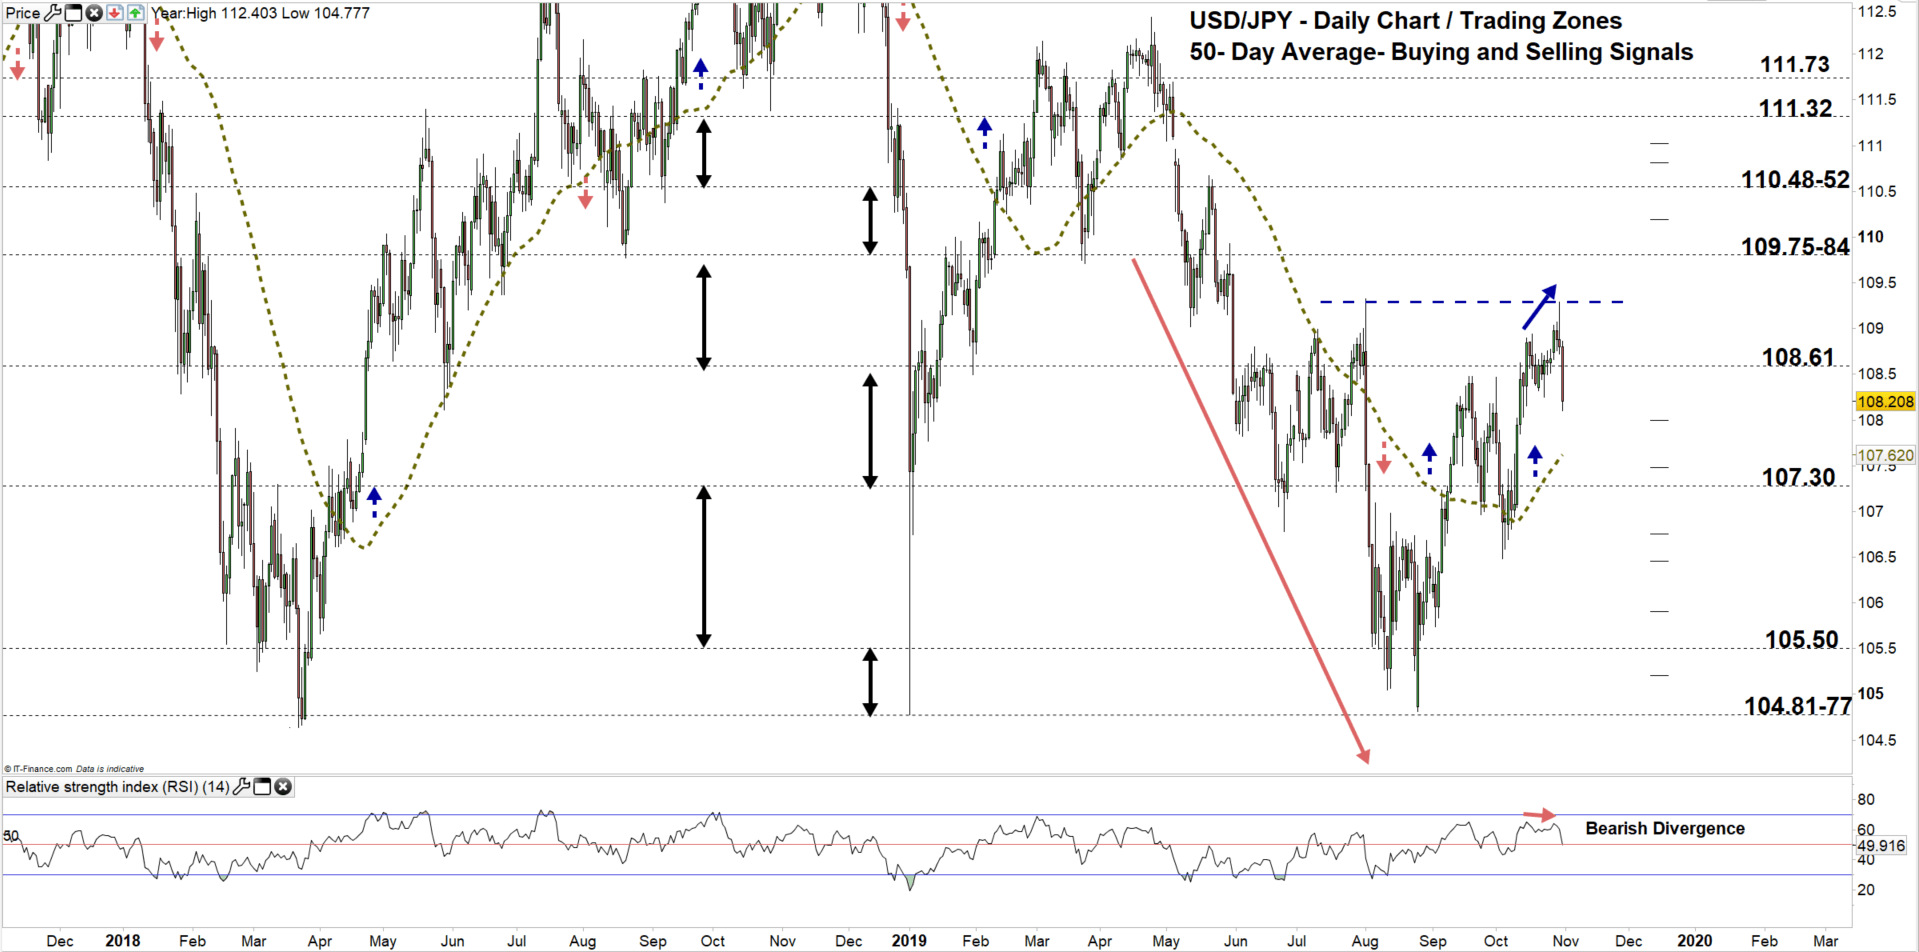
USD/JPY Daily PRice CHART (Nov 20, 2017 – Oct 31, 2019) Zoomed Out
USD/JPY Daily Price CHART (May 20– Oct 31, 2019) Zoomed in
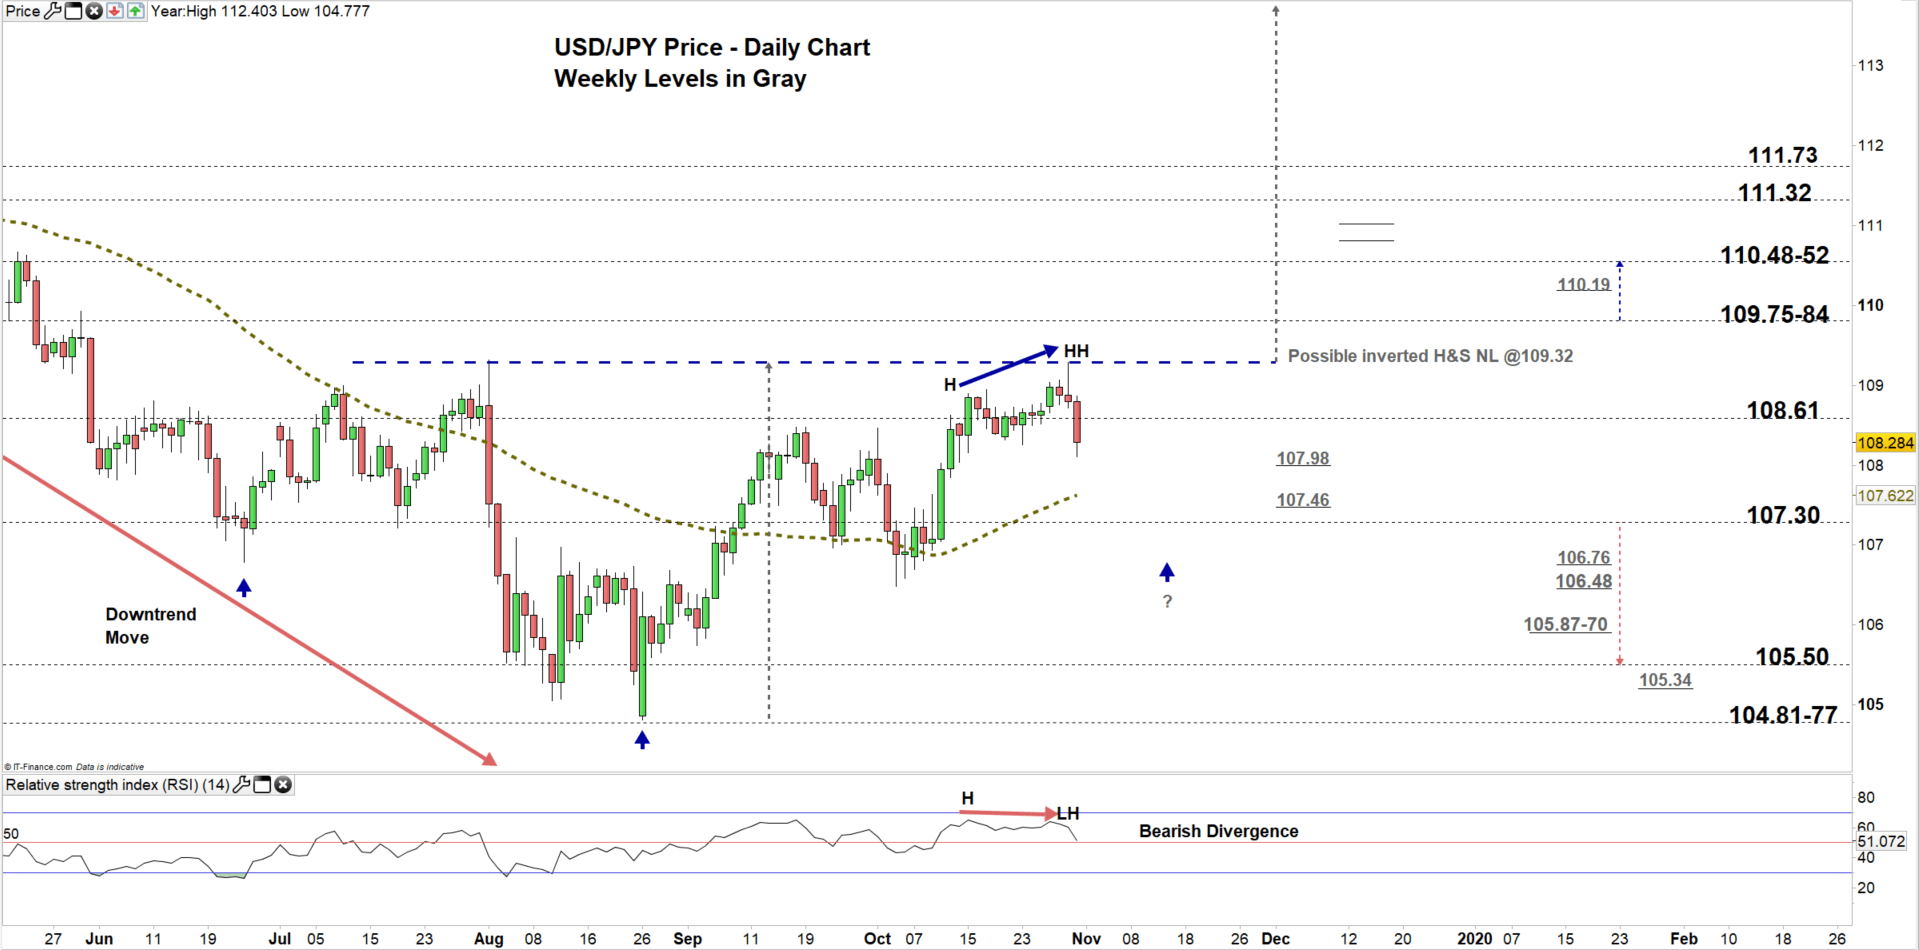
Looking at the daily chart, we notice today the price has declined to lower trading zone 107.30 -108.61.
Hence, a close below the high end of the zone could send USDJPY towards the low end. Further close below the low end could see the price trading even lower towards 105.50. In that scenario, the weekly support levels and area marked on the chart (zoomed in) should be considered.
On the other hand, any failure in closing below the high end could rally USDJPY towards the vicinity of 109.75-84. See the chart to know more about higher trading zone/s with the weekly resistance levels the price would test in a further bullish move.
It’s worth noting that, the pair could be on course to create the second shoulder of an inverted head and shoulders pattern. If the price breaks and remain above 109.32 , this could cause a rally towards 113.00 handle or above.
Just getting started? See our Beginners’ Guide for FX traders
GBP/JPY Daily PRice CHART (July 20, 2017– Oct 31, 2019) Zoomed Out

GBP/JPY Daily PRice CHART (JuLY 31 – Oct 31, 2019) Zoomed In

From the daily chart, we notice on Oct 24, GBP/JPY rebounded nearby the low end of current trading zone 139.00- 140.50. Since Tuesday, the price tested the high end in multiple occasions however, has not been able yet to close above it.
Hence, a successful close above the high end of the zone may push GBPJPY towards the vicinity of 143.09-19. Further close above 143.19 could mean more bullishness towards the vicinity of 144.80-94. Although, the weekly resistance levels underlined on the chart (zoomed in) should be kept in focus.
On the other hand, another failure in closing above the high end of current trading zone could press GBPJPY towards the neckline of double top pattern located at 138.87. This suggests if the pair breaks and remains below the neckline, it could correct lower towards 136.40. Nevertheless, the weekly support levels underscored on the chart should be watched closely.
Written By: Mahmoud Alkudsi
Please feel free to contact me on Twitter: @Malkudsi


