Japanese Yen Technical Analysis Talking Points:
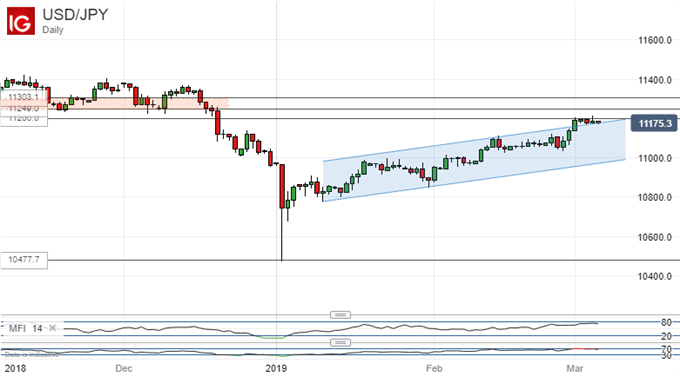
- USD/JPY has broken above its 2019 uptrend channel
- However, it hasn’t yet managed to top 112.00
- Even if it does, an important resistance band will loom
Get live and interactive coverage of all major Japanese economic data at the DailyFX Webinars. We’d love to have you join us.
The Japanese Yen remains on the defensive against the US Dollar, even if the latter is making heavy weather of a key psychological resistance point.
USD/JPY has managed to rise above the downtrend channel previously dominant since January 10. It was an extension of the rise seen consistently from this year’s lows, printed on January 2.

US Dollar bulls have yet to conclusively push trade above the 112.00 handle despite trying for a few days now. It looks as though they will probably succeed in doing so either this week or next, assuming that fundamental risk appetite endures and isn’t thrown a Yen-strengthening curveball from left-field.
Even if they do, though, there will remain resistance beyond the psychological with which those bulls will have to contend if they are to solidify their gains.
There’s a band of resistance between 112.48 and 113.03 which will be important once the 112.00 level has been topped. That band has been an important gateway to significant highs in trade going back to September last year and Dollar bulls should be aware that time spent above it has tended to be fleeting and could well prove so once again unless the pair can be pushed convincingly beyond the upper boundary.
USD/JPY reversals will probably find near-term daily chart support between 111.05 and 110.23. That range bounded trade between February 11 and 28. Of course the pair would remain solidly in its uptrend even if that range were to break, but it would certainly look less comfortable there than it has in the last two weeks.
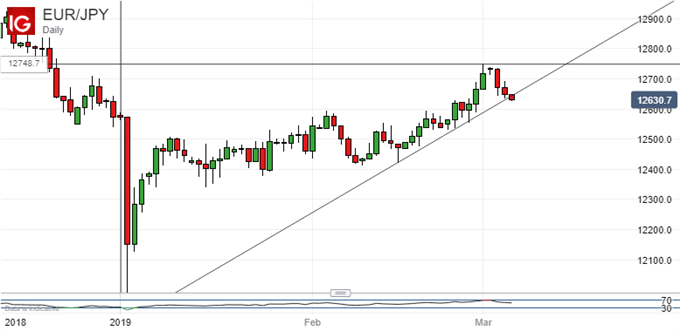
Meanwhile, the Euro has been creeping doggedly higher against the Japanese Yen since January 1, but that process looks to be stalling.

If this downtrend break is confirmed by daily or weekly closes beneath it then the first Fibonacci retracement support of this year’s rise will be in focus. It comes in at 126.02, with the next, 38.2% prop at 125.12.
Resources for Traders
Whether you’re new to trading or an old hand DailyFX has plenty of resources to help you. There’s our trading sentiment indicator which shows you live how IG clients are positioned right now. We also hold educational and analytical webinars and offer trading guides, with one specifically aimed at those new to foreign exchange markets. There’s also a Bitcoin guide. Be sure to make the most of them all. They were written by our seasoned trading experts and they’re all free.
--- Written by David Cottle, DailyFX Research
Follow David on Twitter @DavidCottleFX or use the Comments section below to get in touch!


