


Japanese Yen Technical Analysis Talking Points:
- USD/JPY remains biased upward
- For as long as key support holds it look set for gains
- EUR/JPY looks shakier and more consolidative
Get live and interactive coverage of all major Japanese economic data at the DailyFX Webinars. We’d love to have you join us.
In terms of its broad, daily-chart action, the Japanese Yen remains on the defensive against the US Dollar. USD/JPY is still clearly far above the uptrend line which has held good since that pair made its lows for 2018, back in March.
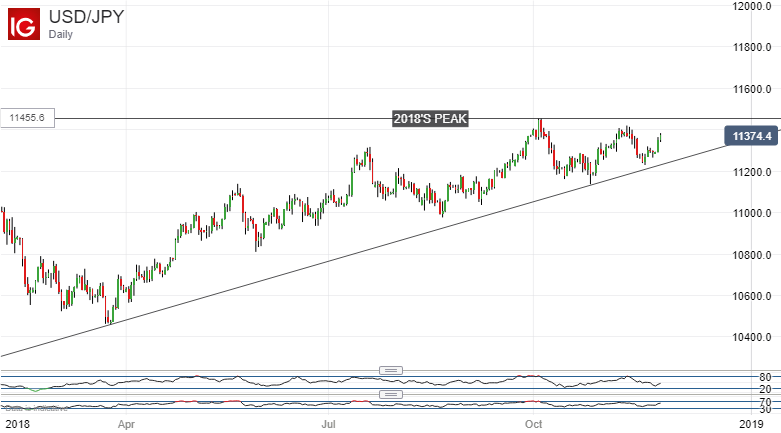
Although the clear procession of higher lows visible here will probably reassure US Dollar bulls, it’s also notable that meaningful higher highs have been in short supply since early October when USD/JPY printed its peak for 2018 so far. Whether or not we see the Dollar surpass that will probably depend on the fate of an important range of support now just below the market. It centers around the 122.22 level, which is also the first, 23.6% Fibonacci retracement of the rise up to this year’s top from the lows of March.
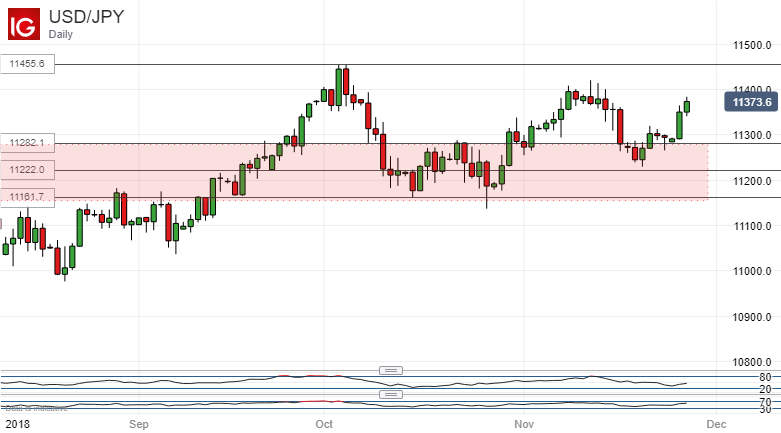
Forming the overall support band above and below that level are the broad range between 112.82 and 116.17 where the pair’s slide was arrested in October. USD/JPY has shown a propensity to quickly trade up and out of this band in the last six weeks and, for as long as it does, then there is every chance that the year’s peak need not stand for much longer.
Keep an eye on daily closing levels within the band though. If they do take USD/JPY sustainably below that central retracement level then it might be as well to prepare for steeper falls. There seems little sign of that as November bows out however, and the path of least resistance still looks as though it is to the upside.
Meanwhile the Euro remains similarly above its long term uptrend line against the Japanese Yen, but it has been confined to a perhaps surprisingly narrow trading range for the last couple of weeks, and perhaps even for longer if you discount the short foray above the range top seen between November 6 and 8.
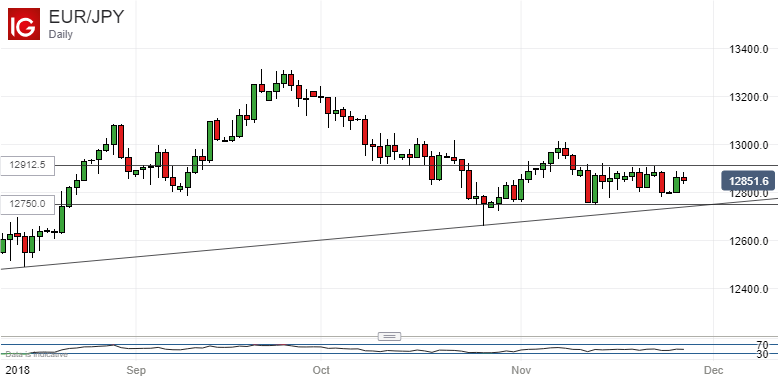
This pattern looks consolidative and may therefore presage a resumption of the status quo ante when it finally breaks. This in turn would suggest more falls for the Euro and perhaps and early test of that uptrend line. However it might be a mistake to be too certain of this and the uncommitted may wish to see a range break either way before stepping in.
Resources for Traders
Whether you’re new to trading or an old hand DailyFX has plenty of resources to help you. There’s our trading sentiment indicator which shows you live how IG clients are positioned right now. We also hold educational and analytical webinars and offer trading guides, with one specifically aimed at those new to foreign exchange markets. There’s also a Bitcoin guide. Be sure to make the most of them all. They were written by our seasoned trading experts and they’re all free.
--- Written by David Cottle, DailyFX Research
Follow David on Twitter @DavidCottleFX or use the Comments section below to get in touch!


