Japanese Yen Technical Analysis Talking Points:
- USD/JPY remains in the ascendant
- But momentum seems to be waning and its uptrend channel is holding on narrowly
- EUR/JPY looks vulnerable too, but be cautious
Find out what the #1 mistake that traders make is and how you can fix it!
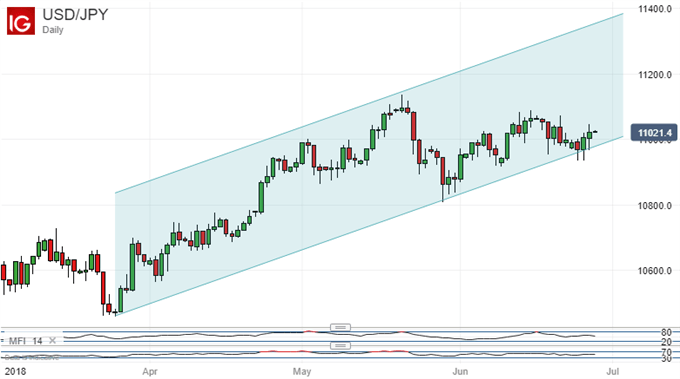
The Japanese Yen has weakened very slightly against the US Dollar this week, but USD/JPY’s overall position looks a little precarious.
The dominant uptrend channel, which had previously contained trade since March 25 is now under a degree of threat. The pair has indeed traded below its lower boundary on an intraday basis this week, albeit that the bulls have so far been able to ensure that in endures from the point of view of daily closes.

The area to watch now on the downside is the 109.77 where the lower bound of the channel now comes in. A close below this would seem to suggest that the pair is headed lower.
To the upside, those bulls would do well to try and top mid-June’s peaks around 110.80 in short order. If they can’t then there’s a clear risk of a bearish head and shoulders pattern appearing on the daily chart.
For the moment, however, the first, 23.6% Fibonacci retracement of the rise up from those March lows appears to be providing support. It comes in at 109.81. That is a level which the pair has essentially coalesced around for the past couple of weeks, and which also provided the base for the current, modest bounce, back on June 26.
For as long as that level can hold on a daily closing basis then bulls probably have reason to hope that this month’s peaks, at least, can be re-scaled.
However, should it give way then focus would shift to the second Fibonacci retracement. That’s at 108.83, and a move down to those levels would probably mean that the uptrend channel had been conclusively broken.
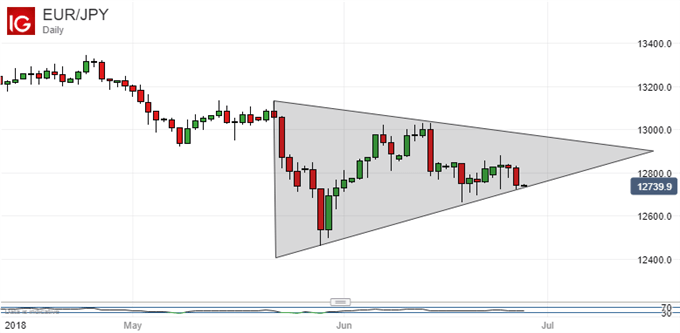
EUR/JPY’s daily chart seems to show a rather protracted pennant formation which has been developing since late May.

This formation could still have some way to run, but, as it is a ‘continuation pattern’, the previous status quo dominate again once it breaks. This could be bad news for Euro bulls as that would suggest renewed downward momentum.
It could pay to trade this possibility cautiously though. The cross is now below its 20-, 50- and 100-day moving averages and its momentum indicators suggest balance rather than overbuying.
Resources for Traders
Whether you’re new to trading or an old hand DailyFX has plenty of resources to help you. There’s our trading sentiment indicator which shows you live how IG clients are positioned right now. We also hold educational and analytical webinars and offer trading guides, with one specifically aimed at those new to foreign exchange markets. There’s also a Bitcoin guide. Be sure to make the most of them all. They were written by our seasoned trading experts and they’re all free.
--- Written by David Cottle, DailyFX Research
Follow David on Twitter @DavidCottleFX or use the Comments section below to get in touch!


